Volvo 2012 Annual Report Download - page 98
Download and view the complete annual report
Please find page 98 of the 2012 Volvo annual report below. You can navigate through the pages in the report by either clicking on the pages listed below, or by using the keyword search tool below to find specific information within the annual report.-
 1
1 -
2
-
3
-
4
-
5
-
6
-
7
-
8
-
9
-
10
-
11
-
12
-
13
-
14
-
15
-
16
-
17
-
18
-
19
-
20
-
21
-
22
-
23
-
24
-
25
-
26
-
27
-
28
-
29
-
30
-
31
-
32
-
33
-
34
-
35
-
36
-
37
-
38
-
39
-
40
-
41
-
42
-
43
-
44
-
45
-
46
-
47
-
48
-
49
-
50
-
51
-
52
-
53
-
54
-
55
-
56
-
57
-
58
-
59
-
60
-
61
-
62
-
63
-
64
-
65
-
66
-
67
-
68
-
69
-
70
-
71
-
72
-
73
-
74
-
75
-
76
-
77
-
78
-
79
-
80
-
81
-
82
-
83
-
84
-
85
-
86
-
87
-
 88
88 -
 89
89 -
 90
90 -
 91
91 -
 92
92 -
 93
93 -
 94
94 -
 95
95 -
 96
96 -
 97
97 -
 98
98 -
 99
99 -
 100
100 -
 101
101 -
 102
102 -
 103
103 -
 104
104 -
 105
105 -
 106
106 -
 107
107 -
 108
108 -
109
-
110
-
111
-
112
-
113
-
114
-
115
-
116
-
117
-
118
-
119
-
120
-
121
-
122
-
123
-
124
-
125
-
126
-
127
-
128
-
129
-
130
-
131
-
132
-
133
-
134
-
135
-
136
-
137
-
138
-
139
-
140
-
141
-
142
-
143
-
144
-
145
-
146
-
147
-
148
-
149
-
150
-
151
-
152
-
153
-
154
-
155
-
156
-
157
-
158
-
159
-
160
-
161
-
162
-
163
-
164
-
165
-
166
-
167
-
168
-
169
-
170
-
171
-
172
-
173
-
174
-
175
-
176
-
177
-
178
-
179
-
180
-
181
-
182
-
183
-
184
-
185
-
186
-
187
-
188
-
189
-
190
 |
 |

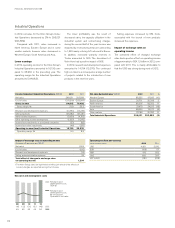
The Volvo Group’s cash, cash equivalents and
marketable securities combined, amounted to
SEK 28.9 billion at December 31, 2012 which
includes SEK 0.2 billion not available for use by
the Volvo Group and SEK 9.4 billion where other
limitations exist, mainly liquid funds in countries
where exchange controls or other legal restric-
tions apply. In addition to this, granted but not uti-
lized credit facilities amounted to SEK 33.1 billion.
Total assets in the Volvo Group amounted to
SEK 338.7 billion as of December 31, 2012, a
decrease of SEK 14.5 billion compared to year-
end 2011. The decrease is mainly a result of
changes in currency rates and the divestment
of Volvo Aero which is offset by increased cus-
tomer financing receivables due to portfolio
growth in the Customer Finance Operations
Net debt in the Volvo Group’s Industrial Operations amounted to SEK 23.0 billion at December 31, 2012,
equal to 29.3% of shareholders’ equity. Excluding provisions for post-employment benefits the Industrial
Operation’s net debt amounted to SEK 19.0 billion, which was equal to 24.3% of shareholders’ equity.
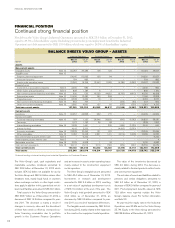
FINANCIAL POSITION
Continued strong financial position
BALANCE SHEETS VOLVO GROUP – ASSETS
Industrial Operations Customer Finance Eliminations Volvo Group
SEK M
Dec 31
2012
Dec 31
2011
Dec 31
2012
Dec 31
2011
Dec 31
2012
Dec 31
2011
Dec 31
2012
Dec 31
2011
Assets
Non-current assets
Intangible assets Note 12 40,267 39,385 106 122 – – 40,373 39,507
Tangible assets Note 13
Property, plant and equipment 54,145 53,563 105 94 – – 54,250 53,657
Investment property 754 883 – – – – 754 883
Assets under operating leases 21,263 16,749 12,543 11, 52 5 (4,784) (4,352) 29,022 23,922
Financial assets
Investments in associated companies Note 5 2,045 684 – – – – 2,045 684
Other shares and participations Note 5 839 1,187 6 3 – – 845 1,190
Non-current customer-financing receivables Note 15 600 579 47,329 44,651 (6,773) (4,612) 41,156 40,618
Deferred tax assets Note 10 10,406 12,480 760 358 – – 11,16 6 12,838
Prepaid pensions Note 20 2,708 2,263 16 14 – – 2,724 2,277
Non-current interest-bearing receivables Note 16 653 757 – – (316) (63) 337 694
Other non-current receivables Note 16 3,565 4,500 127 50 (373) (235) 3,319 4,315
Total non-current assets 137,24 5 133,030 60,992 56,817 (12,246) (9,262) 185,991 180,585
Current assets
Inventories Note 17 40,057 43,828 352 771 – – 40,409 44,599
Current receivables
Customer-financing receivables Note 15 797 1,123 39,946 38,050 (910) (1,092) 39,833 38,081
Tax assets 1,173 1,152 35 48 – – 1,208 1,200
Interest-bearing receivables Note 16 3,038 1,461 – 226 (464) (1,020) 2, 574 667
Internal funding14,612 2,253 – – (4,612) (2,253) – –
Accounts receivable Note 16 27,228 27,492 121 207 – – 27,349 27,699
Other receivables Note 16 11, 9 52 13,438 2,651 1, 411 (2 ,114) (1,024) 12,489 13,825
Non interest-bearing assets held for sale Note 3 – 9,344 – – – – – 9,344
Interest-bearing assets held for sale Note 3 – 4 – – – – – 4
Marketable securities Note 18 3,129 6,838 1 24 – – 3,130 6,862
Cash and cash equivalents Note 18 24,017 2 9 ,113 2 ,116 1,593 (374) (327) 25,759 30,379
Total current assets 116,003 136,046 45,222 42,330 (8 ,474) (5,717) 152,751 172,659
Total assets 253,248 269,076 106,214 99,147 (20,720) (14,979) 338,742 353,244
1 Internal funding is internal lending from Industrial Operations to Customer Finance.
and an increase in assets under operating lease
mainly related to the construction equipment
rental operation.
The Volvo Group’s intangible assets amounted
to SEK 40.4 billion as of December 31, 2012.
Investments in research and development
amounted to SEK 5.4 billion in 2012, resulting
in a net value of capitalized development costs
of SEK 13.4 billion at the end of the year. The
Volvo Group’s total goodwill amounted to SEK
23.3 billion as of December 31, 2012, an
decrease by SEK 0.6 billion compared to year-
end 2011 as a result of translation differences.
The tangible assets increased by SEK 5.6 bil-
lion during 2012, mainly related to the expansion
in the construction equipment rental operation.
The value of the inventories decreased by
SEK 4.2 billion during 2012. The decrease is
mainly related to finished products within trucks
and construction equipment.
The net value of assets and liabilities related to
pensions and similar obligations amounted to
SEK 4.0 billion as of December 31, 2012, a
decrease of SEK 0.4 billion compared to year-end
2011. Post-employment benefits valued at SEK
13.9 billion were reported outside the Volvo
Group’s balance sheet. For further information
see Note 20.
At year-end, the equity ratio in the Industrial
Operations was 30.9% and in the Volvo Group
25.7%. Equity in the Volvo Group amounted to
SEK 86.9 billion at December 31, 2012.
94
FINANCIAL INFORMATION 2012