Volvo 2012 Annual Report Download - page 101
Download and view the complete annual report
Please find page 101 of the 2012 Volvo annual report below. You can navigate through the pages in the report by either clicking on the pages listed below, or by using the keyword search tool below to find specific information within the annual report.-
 1
1 -
2
-
3
-
4
-
5
-
6
-
7
-
8
-
9
-
10
-
11
-
12
-
13
-
14
-
15
-
16
-
17
-
18
-
19
-
20
-
21
-
22
-
23
-
24
-
25
-
26
-
27
-
28
-
29
-
30
-
31
-
32
-
33
-
34
-
35
-
36
-
37
-
38
-
39
-
40
-
41
-
42
-
43
-
44
-
45
-
46
-
47
-
48
-
49
-
50
-
51
-
52
-
53
-
54
-
55
-
56
-
57
-
58
-
59
-
60
-
61
-
62
-
63
-
64
-
65
-
66
-
67
-
68
-
69
-
70
-
71
-
72
-
73
-
74
-
75
-
76
-
77
-
78
-
79
-
80
-
81
-
82
-
83
-
84
-
85
-
86
-
87
-
88
-
89
-
90
-
 91
91 -
 92
92 -
 93
93 -
 94
94 -
 95
95 -
 96
96 -
 97
97 -
 98
98 -
 99
99 -
 100
100 -
 101
101 -
 102
102 -
 103
103 -
 104
104 -
 105
105 -
 106
106 -
 107
107 -
 108
108 -
 109
109 -
 110
110 -
 111
111 -
112
-
113
-
114
-
115
-
116
-
117
-
118
-
119
-
120
-
121
-
122
-
123
-
124
-
125
-
126
-
127
-
128
-
129
-
130
-
131
-
132
-
133
-
134
-
135
-
136
-
137
-
138
-
139
-
140
-
141
-
142
-
143
-
144
-
145
-
146
-
147
-
148
-
149
-
150
-
151
-
152
-
153
-
154
-
155
-
156
-
157
-
158
-
159
-
160
-
161
-
162
-
163
-
164
-
165
-
166
-
167
-
168
-
169
-
170
-
171
-
172
-
173
-
174
-
175
-
176
-
177
-
178
-
179
-
180
-
181
-
182
-
183
-
184
-
185
-
186
-
187
-
188
-
189
-
190
 |
 |

The cash flow within Industrial Operations was
positively affected by the operating income and
negatively affected by the increased working
capital. Accounts receivables increased with
SEK 1.2 billion while inventories decreased
SEK 0.6 billion and the trade payables
decreased SEK 7.6 billion.
Financial items and paid income taxes had a
SEK 7.3 billion negative effect on cash flow
within Industrial Operations, mainly through
payments of interests and income tax.
Operating cash flow within Customer Finance
was a negative SEK 14.8 billion (neg: SEK 14.1
billion), mainly due to increased customer
financing-receivables.
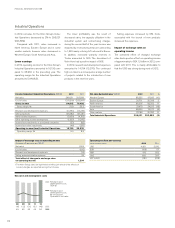
Investments
The industrial operations’ investments in fixed
assets and capitalized R&D during 2012
amounted to SEK 14.6 billion (12.6).
Capital expenditures in Trucks amounted to
SEK 10.7 billion (8.4). As for previous year, the
capital expenditures within Trucks consist to a
large extent of investments related to product
renewals in the product program, including
emission regulations, with product development
activities and required adaptations in the plants.
There are also large investments in capacity for
cylinder blocks and cylinder heads in Skövde,
Sweden, and cab paint capacity in Curitiba,
Brazil. During 2012 there were also invest-
ments in the dealer network and workshops,
mainly in Europe and Asia (mainly Japan and
Thailand), as well as in our joint venture VE
Commercial Vehicles (VECV).
Capital expenditures, Industrial Operations
12111009
3.2
4.0
7.1
2.6
5.0
7.7
2.1
4.3
10.5
Capitalized development
costs, SEK bn
Capital expenditures,
% of net sales
Property, plant and
equipment, SEK bn
08
4.1
4.1
8.5
5.1
4.9
9.5
Self-financing ratio,
Industrial Operations %
Cash-flow from operating activities
divided by net investments in fixed
assets and leasing assets.
1211100908
72210294(16)78
Operating cash flow,
Industrial Operations, SEK bn
2012
Q4
4.7
Q3
(7.2)
Q2
2.5
Q1
(4.9)
2011
Q4
10.7
Q3
2.2
Q2
5.2
Q1
(4.0)
Capital expenditures for Construction Equip-
ment amounted to SEK 1.7 billion (1.9). The
major investments during 2012 continued on
strategic areas such as excavator assembly
plant in Kaluga, Russia, facilities (plant and
sales office) in Shippensburg, US, to support
the North American markets, and the Jinan
Technology center in China handling develop-
ment of BRIC machines for both Volvo and
SDLG brand. Product related investments dur-
ing the year refer to the latest emission regula-
tions in Europe and North America (Tier 4 final),
and market specific requirements for new mod-
els in the BRIC countries.
The investments in Buses were SEK 0.3 billion
(0.3), and in Penta SEK 0.2 billion (0.2). For 2011
Volvo Aero was included with SEK 0.5 billion, but
is not included in the comparison for 2012 due to
reclassification to assets held for sale.
Investments in Volvo Rents, besides leasing
assets, were SEK 0.6 billion (0.1) during 2012,
and are mainly referable to delivery vehicles.
These are directly related to the expansion of
fleet and the additional store locations added
during the year.
Investments in leasing assets amounted to
SEK 3.6 billion (1.4), the increase from last year
is related to the build-up phase that Volvo Rents
has been in during 2012, increasing its pres-
ence and expanded the fleet through acquisi-
tions and greenfield investments.
For 2013, the Volvo Group estimate that
investments in property, plant and equipment
will be more or less on the same level as for
2012. The investments will mainly cover the
industrial footprint and tooling related to the
product renewals, and also needs in order to
deliver on the strategic objectives.
Acquisitions and divestments
In September 2012 AB Volvo increased its
shareholding in Deutz AG to just over 25%
which had a negative impact on cash flow of
SEK 1.1 billion.
In October 2012 the sale of Volvo Aero to the
British company GKN was finalized. Acquired
operations refer mainly to the acquisition of the
French automotive manufacturer Panhard as
well as several minor acquisitions of assets and
liabilities in construction equipment rental
operations.
Acquired and divested operations 2012 had
a positive impact on cash flow of SEK 3.4 billion
(negative 1.6).
Financing and dividend
Net borrowings increased cash and cash equiv-
alents by SEK 14.1 billion during 2012.
During the year dividend of SEK 6.1 billion,
corresponding to SEK 3.00 per share, was paid
to the shareholders of AB Volvo.
Change in cash and cash equivalents
The Volvo Group’s cash and cash equivalents
decreased by SEK 4.6 billion during the year and
amounted to SEK 25.8 billion at December 31,
2012.
Refer to Note 29 for principles for preparing
the cash flow analysis.
97