Volvo 2012 Annual Report Download - page 129
Download and view the complete annual report
Please find page 129 of the 2012 Volvo annual report below. You can navigate through the pages in the report by either clicking on the pages listed below, or by using the keyword search tool below to find specific information within the annual report.-
 1
1 -
2
-
3
-
4
-
5
-
6
-
7
-
8
-
9
-
10
-
11
-
12
-
13
-
14
-
15
-
16
-
17
-
18
-
19
-
20
-
21
-
22
-
23
-
24
-
25
-
26
-
27
-
28
-
29
-
30
-
31
-
32
-
33
-
34
-
35
-
36
-
37
-
38
-
39
-
40
-
41
-
42
-
43
-
44
-
45
-
46
-
47
-
48
-
49
-
50
-
51
-
52
-
53
-
54
-
55
-
56
-
57
-
58
-
59
-
60
-
61
-
62
-
63
-
64
-
65
-
66
-
67
-
68
-
69
-
70
-
71
-
72
-
73
-
74
-
75
-
76
-
77
-
78
-
79
-
80
-
81
-
82
-
83
-
84
-
85
-
86
-
87
-
88
-
89
-
90
-
91
-
92
-
93
-
94
-
95
-
96
-
97
-
98
-
99
-
100
-
101
-
102
-
103
-
104
-
105
-
106
-
107
-
108
-
109
-
110
-
111
-
112
-
113
-
114
-
115
-
116
-
117
-
118
-
 119
119 -
 120
120 -
 121
121 -
 122
122 -
 123
123 -
 124
124 -
 125
125 -
 126
126 -
 127
127 -
 128
128 -
 129
129 -
 130
130 -
 131
131 -
 132
132 -
 133
133 -
 134
134 -
 135
135 -
 136
136 -
 137
137 -
 138
138 -
 139
139 -
140
-
141
-
142
-
143
-
144
-
145
-
146
-
147
-
148
-
149
-
150
-
151
-
152
-
153
-
154
-
155
-
156
-
157
-
158
-
159
-
160
-
161
-
162
-
163
-
164
-
165
-
166
-
167
-
168
-
169
-
170
-
171
-
172
-
173
-
174
-
175
-
176
-
177
-
178
-
179
-
180
-
181
-
182
-
183
-
184
-
185
-
186
-
187
-
188
-
189
-
190
 |
 |
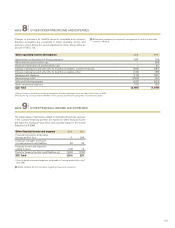
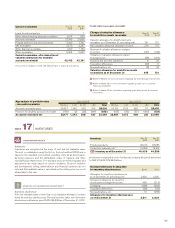
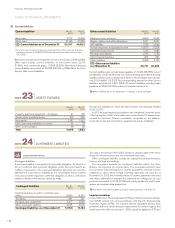
Current receivables Dec 31,
2012 Dec 31,
2011
Loans to external parties – 1
Other interest-bearing financial receivables 2,574 666
Accounts receivable 27,349 27,699
Prepaid expenses and accrued income 2,392 2,761
VAT receivables 3,573 3,387
Other financial receivables 1,220 1,746
Other receivables 5,304 5,932
Current receivables, after deduction of
valuation allowances for doubtful
accounts receivable142,412 42,191
1 Of current receivables, 31,143 (30,133) pertains to financial instruments.
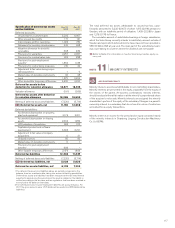
Credit risks in accounts receivable
Change of valuation allowance
for doubtful accounts receivable Dec 31,
2012 Dec 31,
2011
Valuation allowance for doubtful accounts
recivables as of December 31, preceding year 731 721
New valuation allowance charged to income 219 175
Reversal of valuation allowance charged
to income (147) (126)
Utilization of valuation allowance related
to actual losses (88) (100)
Acquired and divested operations 833
Translation differences (40) 5
Reclassifications, etc. (8) 24
Valuation allowance for doubtful accounts
receivables as of December 31 675 731
Refer to Note 4 for more information regarding the Volvo Group’s financial risks.
Refer to Note 15 for more information regarding credit risk in customer
financing receivables.
Refer to Note 30 for information regarding goals and policies for financial
instruments.
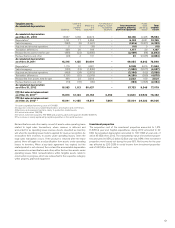
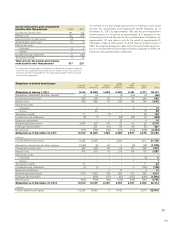
Age analysis of portfolio value
– Accounts receivable
Dec 31, 2012 Dec 31, 2011
Not Due 1–30 31–90 >90 Total Not Due 1–30 31–90 >90 Total
Accounts receivable gross 25,327 1,246 533 918 28,024 26,152 1,102 465 711 28,430
Provision for doubtful accounts receivable (156) (3) (25) (491) (675) (155) (30) (57) (490) (731)
Accounts receivable net 25,171 1,243 508 427 27, 3 49 25,997 1,073 408 221 27,699
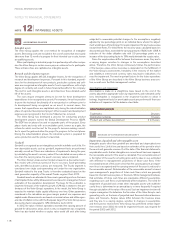
Inventories
Inventories are recognized at the lower of cost and net realizable value.
The cost is established using the first-in, first-out method (FIFO) and is
based on the standard cost method, including costs for all direct manu-
facturing expenses and the attributable share of capacity and other
manufacturing-related costs. The standard costs are tested regularly and
adjustments are made based on current conditions. Costs for research
and development, selling, administration and financial expenses are not
included. Net realizable value is calculated as the selling price less costs
attributable to the sale.
Inventory Dec 31,
2012 Dec 31,
2011
Finished products 26,013 28,985
Production materials, etc. 14,396 15,614
B/S Inventory as of December 31 40,409 44,599
Inventories recognized as cost of sold products during the period amounted
to SEK 212,469 (219,946) billion.
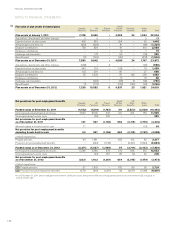
Increase (decrease) in allowance
for inventory obsolescence 2012 2 011
Allowance for inventory obsolescence
as of December 31, preceding year 2,624 3,382
Increase in allowance for inventory
obsolescence charged to income 456 (213)
Scrapping (390) (264)
Translation differences (92) (23)
Reclassifications, etc. 13 (258)
Allowance for inventory obsolescence
as of December 31 2 ,611 2,624
ACCOUNTING POLICY
Inventory obsolescence
If the net realizable value is lower than cost, a valuation allowance is estab-
lished for inventory obsolescence. The total inventory value, net of inventory
obsolescence allowance, was 40,409 (44,599) as of December 31, 2012.
SOURCES OF ESTIMATION UNCERTAINTY
!
NOTE 17
INVENTORIES
125