Volvo 2012 Annual Report Download - page 155
Download and view the complete annual report
Please find page 155 of the 2012 Volvo annual report below. You can navigate through the pages in the report by either clicking on the pages listed below, or by using the keyword search tool below to find specific information within the annual report.-
 1
1 -
2
-
3
-
4
-
5
-
6
-
7
-
8
-
9
-
10
-
11
-
12
-
13
-
14
-
15
-
16
-
17
-
18
-
19
-
20
-
21
-
22
-
23
-
24
-
25
-
26
-
27
-
28
-
29
-
30
-
31
-
32
-
33
-
34
-
35
-
36
-
37
-
38
-
39
-
40
-
41
-
42
-
43
-
44
-
45
-
46
-
47
-
48
-
49
-
50
-
51
-
52
-
53
-
54
-
55
-
56
-
57
-
58
-
59
-
60
-
61
-
62
-
63
-
64
-
65
-
66
-
67
-
68
-
69
-
70
-
71
-
72
-
73
-
74
-
75
-
76
-
77
-
78
-
79
-
80
-
81
-
82
-
83
-
84
-
85
-
86
-
87
-
88
-
89
-
90
-
91
-
92
-
93
-
94
-
95
-
96
-
97
-
98
-
99
-
100
-
101
-
102
-
103
-
104
-
105
-
106
-
107
-
108
-
109
-
110
-
111
-
112
-
113
-
114
-
115
-
116
-
117
-
118
-
119
-
120
-
121
-
122
-
123
-
124
-
125
-
126
-
127
-
128
-
129
-
130
-
131
-
132
-
133
-
134
-
135
-
136
-
137
-
138
-
139
-
140
-
141
-
142
-
143
-
144
-
 145
145 -
 146
146 -
 147
147 -
 148
148 -
 149
149 -
 150
150 -
 151
151 -
 152
152 -
 153
153 -
 154
154 -
 155
155 -
 156
156 -
 157
157 -
 158
158 -
 159
159 -
 160
160 -
 161
161 -
 162
162 -
 163
163 -
 164
164 -
 165
165 -
166
-
167
-
168
-
169
-
170
-
171
-
172
-
173
-
174
-
175
-
176
-
177
-
178
-
179
-
180
-
181
-
182
-
183
-
184
-
185
-
186
-
187
-
188
-
189
-
190
 |
 |

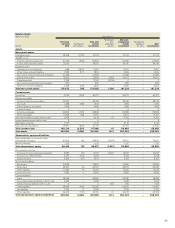
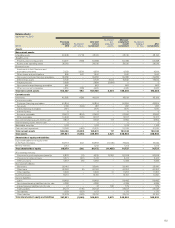
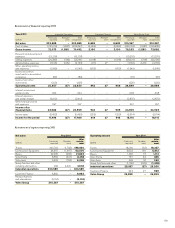
Balance sheets
June 30, 2012 Volvo Group
SEK M
Previously
reported
2012
Restatement
joint ventures
After joint
venture
restatement
Restatement
post-
employment
benefits
After post-
employment
benefit
restatement
Restatement
hedging of
firm flows
After
restatements
Assets
Non-current assets
Intangible assets 40,440 (1,677) 38,763 –38,763 –38,763
Tangible assets
Property, plant and equipment 54,851 (736) 54,115 –54,115 –54,115
Assets under operating leases 26,354 –26,354 –26,354 –26,354
Financial assets
Investments in Joint Venturesand
associated companies 679 2,531 3,210 –3,210 –3,210
Other shares and participations 1,173 540 1,713 –1,713 –1,713
Non-current customer-financing receivables 39,348 –39,348 –39,348 –39,348
Deferred tax assets 13,672 –13,672 4,246 17, 918 –17,918
Prepaid pensions 2,699 –2,699 (2,699) 0 – 0
Non-current interest-bearing receivables 584 –584 –584 –584
Other non-current receivables 4,654 (180) 4,474 –4,474 –4,474
Total non-current assets 184,454 478 184,932 1,547 186,479 –186,479
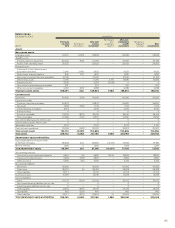
Current assets
Inventories 47,941 (467) 47,474 –47,474 –47,474
Current receivables
Customer-financing receivables 43,843 –43,843 –43,843 –43,843
Tax assets 1,187 (175) 1,012 –1,012 –1,012
Interest-bearing receivables 1,404 –1,404 –1,404 –1,404
Internal funding 0 – 0 – 0 – 0
Accounts receivable 31,257 (785) 30,472 –30,472 –30,472
Other receivables 15,515 (115 ) 15,400 –15,400 –15,400
Non interest-bearing assets held for sale 9,468 –9,468 117 9,585 –9,585
Interest-bearing assets held for sale 2 – 2 – 2 – 2
Marketable securities 5,023 –5,023 –5,023 –5,023
Cash and cash equivalents 26,068 (585) 25,483 –25,483 –25,483
Total current assets 181,708 (2,127) 179,581 117 179,698 –179,698
Total assets 366,162 (1,650) 364,512 1,664 366,176 –366,176
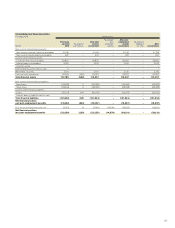
Shareholders’ equity and liabilities
Equity attributable to the equity holder
of the Parent Company 86,120 104 86,224 (9,269) 76,955 –76,955
Minority interests 1,262 –1,262 –1,262 –1,262
Total shareholders’ equity 87, 382 104 87, 486 (9,269) 78,217 –78,217
Non-current provisions
Provisions for post-employment benefits 7,012 (13) 6,999 10,370 17, 369 –17,369
Provisions for deferred taxes 6,515 (162) 6,353 –6,353 –6,353
Other provisions 5,598 (71) 5,527 –5,527 –5,527
Non-current liabilities
Bond loans 37,089 –37,089 –37,089 –37,089
Other loans 47,710 (4) 47,706 –47,706 –47,706
Other liabilities 11,182 –11,18 2 –11,18 2 –11,18 2
Current provisions 10,556 –10,556 –10,556 –10,556
Current liabilities
Loans 54,076 –54,076 –54,076 –54,076
Non interest-bearing liabilities held for sale 4,466 –4,466 –4,466 –4,466
Interest-bearing liabilities held for sale 39 –39 532 571 –571
Trade payables 56,092 (698) 55,394 –55,394 –55,394
Tax liabilities 2 ,115 (179) 1,936 –1,936 –1,936
Other liabilities 36,330 (625) 35,705 31 35,736 –35,736
Total shareholders’ equity and liabilities 366,162 (1,650) 364,512 1,664 366,176 –366,176
151