Volvo 2012 Annual Report Download - page 132
Download and view the complete annual report
Please find page 132 of the 2012 Volvo annual report below. You can navigate through the pages in the report by either clicking on the pages listed below, or by using the keyword search tool below to find specific information within the annual report.-
 1
1 -
2
-
3
-
4
-
5
-
6
-
7
-
8
-
9
-
10
-
11
-
12
-
13
-
14
-
15
-
16
-
17
-
18
-
19
-
20
-
21
-
22
-
23
-
24
-
25
-
26
-
27
-
28
-
29
-
30
-
31
-
32
-
33
-
34
-
35
-
36
-
37
-
38
-
39
-
40
-
41
-
42
-
43
-
44
-
45
-
46
-
47
-
48
-
49
-
50
-
51
-
52
-
53
-
54
-
55
-
56
-
57
-
58
-
59
-
60
-
61
-
62
-
63
-
64
-
65
-
66
-
67
-
68
-
69
-
70
-
71
-
72
-
73
-
74
-
75
-
76
-
77
-
78
-
79
-
80
-
81
-
82
-
83
-
84
-
85
-
86
-
87
-
88
-
89
-
90
-
91
-
92
-
93
-
94
-
95
-
96
-
97
-
98
-
99
-
100
-
101
-
102
-
103
-
104
-
105
-
106
-
107
-
108
-
109
-
110
-
111
-
112
-
113
-
114
-
115
-
116
-
117
-
118
-
119
-
120
-
121
-
 122
122 -
 123
123 -
 124
124 -
 125
125 -
 126
126 -
 127
127 -
 128
128 -
 129
129 -
 130
130 -
 131
131 -
 132
132 -
 133
133 -
 134
134 -
 135
135 -
 136
136 -
 137
137 -
 138
138 -
 139
139 -
 140
140 -
 141
141 -
 142
142 -
143
-
144
-
145
-
146
-
147
-
148
-
149
-
150
-
151
-
152
-
153
-
154
-
155
-
156
-
157
-
158
-
159
-
160
-
161
-
162
-
163
-
164
-
165
-
166
-
167
-
168
-
169
-
170
-
171
-
172
-
173
-
174
-
175
-
176
-
177
-
178
-
179
-
180
-
181
-
182
-
183
-
184
-
185
-
186
-
187
-
188
-
189
-
190
 |
 |

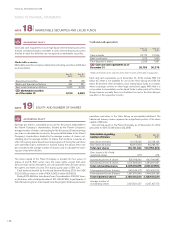
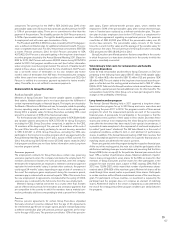
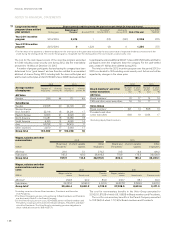
Assumptions applied for actuarial
calculations, % Dec 31,
2012 Dec 31,
2011
Sweden
Discount rate13.25 3.50
Expected return on plan assets26.00 6.00
Expected salary increase 3.00 3.00
Inflation 1.50 1.50
United States
Discount rate1 3 1.75–3.75 3.00–4.75
Expected return on plan assets27.65 7.65
Expected salary increase 3.50 3.00
Inflation 2.00 2.00
France
Discount rate13.75 4.50
Expected salary increase 3.00 3.00
Inflation 1.50 1.50
Great Britain
Discount rate14.25–4.60 4.75–5.00
Expected return on plan assets23.30–4.20 3.60–4.50
Expected salary increases 3.20–3.30 3.30–3.40
Inflation 2.70 3.20
1 The discount rate for each country is determined by reference to market yields
on high–quality corporate bonds. In countries where there is no functioning market
in such bonds, the market yields on government bonds are used. The discount rate
for the Swedish pension obligation is determined by reference to mortgage bonds.
2 Applicable in the subsequent accounting period. These assumptions reflect the
expected long–term return rate on plan assets, based upon historical yield rates
for different categories of investments and weighted in accordance with the
foundation’s investment policy. The expected return has been calculated net of
administrative expenses and applicable taxes.
3 For all plans except one the discount rate used is within the range 3.00–3.75%
(4.25–4.75).
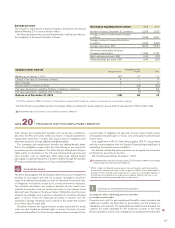
Pension costs 2012 2011
Current year service costs 1,071 867
Interest costs 1,415 1,448
Expected return on plan assets (1,437) (1,405)
Actuarial gains and losses1654 326
Past service costs
– Unvested 9 9
– Vested 360
Curtailments and settlements 35 50
Termination benefits 20 84
Pension costs for the period,
defined–benefit plans 1,770 1,439
Pension costs for defined-contribution plans 2,356 2,032
Total pension costs for the period 4,126 3,471
1 For each plan, actuarial gains and losses are recognized as income or expense
when the accumulated amount exceeds the so called corridor. The income or
expenses are then recognized over the expected average remaining service
period of the employees.
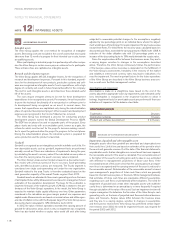
The assumptions include discount rates, health care cost trends rates, infla-
tion, salary growth, long-term return on plan assets, retirement rates, mor-
tality rates and other factors. Health care cost trend assumptions are based
on historical cost data, the near-term outlook, and an assessment of likely
long-term trends. Inflation assumptions are based on an evaluation of exter-
nal market indicators. The salary growth assumptions reflect the historical
trend, the near-term outlook and assumed inflation. Retirement and mortal-
ity rates are based primarily on officially available mortality statistics. The
actuarial assumptions are annually reviewed by Volvo and modified when
deemed appropriate to do so. Actual results that differ from management’s
assumptions are accumulated and amortized over future periods.
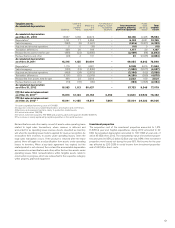
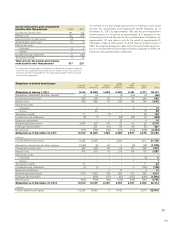
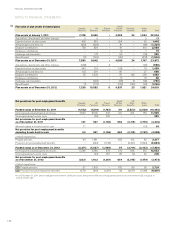
The following tables disclose information about defined-benefit plans in the
Volvo Group. Volvo recognizes the difference between the obligations and
the plan assets adjusted for unrecognized actuarial gains and losses in the
balance sheet. The information refers to assumptions applied for actuarial
calculations, periodical costs and the value of obligations and plan assets at
year-end. The tables also include a reconciliation of obligations and plan
assets during the year and the difference between fair values and carrying
amounts at the balance-sheet date.
Summary of provision for
post–employment benefits 2012 2 011
Obligations (42,472) (40,358)
Fair value of plan assets 24,618 23,873
Funded status (17, 85 4) (16,485)
Unrecognized actuarial (gains) and losses 13,633 11, 9 39
Unrecognized past service costs 248 222
Net provisions for post–employment
benefits (3,973) (4,324)
Whereof related to Assets held for sale – 64
Net provision for post–employment
benefits excluding Assets held for sale (3,973) (4,388)
Assumptions when calculating pensions and other post-employment benefits (cont.)
NOTES TO FINANCIAL STATEMENTS
FINANCIAL INFORMATION 2012
128