Volvo 2012 Annual Report Download - page 137
Download and view the complete annual report
Please find page 137 of the 2012 Volvo annual report below. You can navigate through the pages in the report by either clicking on the pages listed below, or by using the keyword search tool below to find specific information within the annual report.-
 1
1 -
2
-
3
-
4
-
5
-
6
-
7
-
8
-
9
-
10
-
11
-
12
-
13
-
14
-
15
-
16
-
17
-
18
-
19
-
20
-
21
-
22
-
23
-
24
-
25
-
26
-
27
-
28
-
29
-
30
-
31
-
32
-
33
-
34
-
35
-
36
-
37
-
38
-
39
-
40
-
41
-
42
-
43
-
44
-
45
-
46
-
47
-
48
-
49
-
50
-
51
-
52
-
53
-
54
-
55
-
56
-
57
-
58
-
59
-
60
-
61
-
62
-
63
-
64
-
65
-
66
-
67
-
68
-
69
-
70
-
71
-
72
-
73
-
74
-
75
-
76
-
77
-
78
-
79
-
80
-
81
-
82
-
83
-
84
-
85
-
86
-
87
-
88
-
89
-
90
-
91
-
92
-
93
-
94
-
95
-
96
-
97
-
98
-
99
-
100
-
101
-
102
-
103
-
104
-
105
-
106
-
107
-
108
-
109
-
110
-
111
-
112
-
113
-
114
-
115
-
116
-
117
-
118
-
119
-
120
-
121
-
122
-
123
-
124
-
125
-
126
-
 127
127 -
 128
128 -
 129
129 -
 130
130 -
 131
131 -
 132
132 -
 133
133 -
 134
134 -
 135
135 -
 136
136 -
 137
137 -
 138
138 -
 139
139 -
 140
140 -
 141
141 -
 142
142 -
 143
143 -
 144
144 -
 145
145 -
 146
146 -
 147
147 -
148
-
149
-
150
-
151
-
152
-
153
-
154
-
155
-
156
-
157
-
158
-
159
-
160
-
161
-
162
-
163
-
164
-
165
-
166
-
167
-
168
-
169
-
170
-
171
-
172
-
173
-
174
-
175
-
176
-
177
-
178
-
179
-
180
-
181
-
182
-
183
-
184
-
185
-
186
-
187
-
188
-
189
-
190
 |
 |

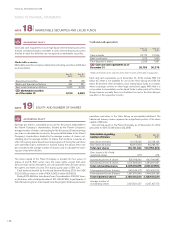
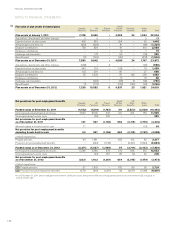
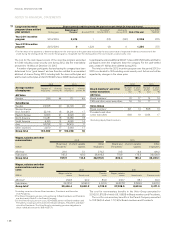
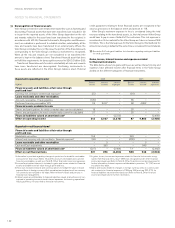
Bond loans Actual interest rate Dec 31, 2012, % Effectiveinterest rate Dec 31, 2012, % Dec 31,
2012 Dec 31,
2011
EUR 2007–2012/2014–2024 0.74–9.89 0.74–9.89 20,725 16,591
SEK 2007–2012/2014–2017 1.90–5.71 1.91–5.71 15,131 15,904
USD 2009/2015 5.98 5.98 4,861 5,165
GBP 2009/2014 6.04 6.18 523 532
CNY2012/2015 3.80–5.93 3.80–6.06 1,852 –
B/S Bond loans as of December 311 43,092 38,192
1 Of which loans raised to finance the credit portfolio of the customer financing operations totalled29,044 (24,501).
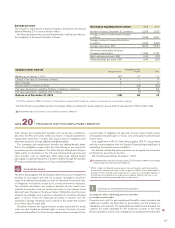
Other loans Actual interest rate
Dec 31, 2012, % Effectiveinterest rate
Dec 31, 2012, % Dec 31,
2012 Dec 31,
2011
USD 2008–2012/2015–2018 0.56–7.50 0.56–7.76 7,902 8,883
EUR 2005–2012/2014–2027 1.49–6.50 1.50–6.50 2,127 2,409
GBP 2011/2014 1.98 1.99 902 925
SEK 2007–2011/2015–2017 1.52–3.22 1.53–3.22 4,270 5,457
CAD 2012/2015 3.06 3.10 675 1,439
MXN 2009–2012/2014–2016 5.74–8.99 5.89–9.37 1,673 1,470
JPY 2007–2012/2014–2017 0.60–1.40 0.60–1.41 7,837 13,132
CHF 2011/2013 1.07 1.07 –736
BRL 2007/2020 4.15 4.28 5,807 5,081
AUD 2012/2015 4.81 6.05 690 1,054
Other loans 4,617 5,509
Revaluation of outstanding derivatives to SEK 1,933 1,670
B/S Other loans as of December 311 38,433 47,765
Bond loans and other loans as of December 31 81,525 85,957
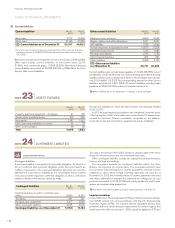
Deferred leasing income 2,247 2,000
Residual value liabilities 4,439 3,608
Accrued expenses service contracts 2,548 1,996
Other non–current financial liabilities 609 701
Other non–current liabilities 871 2,142
B/S Other liabilities as of December 31 10,714 10,447
Non-current liabilities as of December 31 92,239 96,404
1 Of which loans raised to finance the credit portfolio of the customer financing operations 16,874 (24,517). Volvo Treasury employs cross–currency interest swaps to be
able to offer lending and borrowing in various currencies without increasing Volvo Group’s risk. The table on page 95 presents Industrial operations financial net position,
including pensions, listed by currency. Of non–current liabilities, 82,153 (87,923) pertains to financial instruments. Refer also to Note 30 Financial instruments.
Of the above loans, 3.723 (516) was secured.
Refer to Note 23 for an explanation of changes to assets pledged.
Non-currentloans mature as follows:
2014 27,617
2015 17,518
2016 16,071
2017 14,856
2018 450
2019 or later 5,013
Total 81,525
Refer to Note 15 for maturities of non-current customer financing receivables.
The major part of other non-current liabilities will mature within five years.
At year-end 2012, credit facilities granted but not utilized and which
can be used without restrictions amounted to approximately SEK 33,1
billion (33.6). These facilities consisted of stand-by facilities for loans with
varying maturities through 2013 to 2017. A fee is normally charged for the
unused portion of credit facilities and is recognized in profit or loss under
other financial income and expenses.
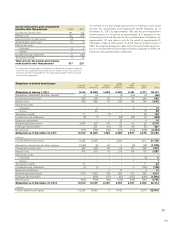
Non-current liabilities
The tables below disclose the Volvo Group’s non-current liabilities in which
the largest loans are listed by currency. The main part are issued by Volvo
Treasury AB. Information regarding loan terms refer to December 31, 2012.
The Volvo Group hedges foreign-exchange and interest-rate risks using
derivative instruments.
Refer to Note 4 Goals and policies in financial risk management and Note 30
Financial Instruments for more information.
NOTE 22
LIABILITIES
133