Volvo 2012 Annual Report Download - page 97
Download and view the complete annual report
Please find page 97 of the 2012 Volvo annual report below. You can navigate through the pages in the report by either clicking on the pages listed below, or by using the keyword search tool below to find specific information within the annual report.-
 1
1 -
2
-
3
-
4
-
5
-
6
-
7
-
8
-
9
-
10
-
11
-
12
-
13
-
14
-
15
-
16
-
17
-
18
-
19
-
20
-
21
-
22
-
23
-
24
-
25
-
26
-
27
-
28
-
29
-
30
-
31
-
32
-
33
-
34
-
35
-
36
-
37
-
38
-
39
-
40
-
41
-
42
-
43
-
44
-
45
-
46
-
47
-
48
-
49
-
50
-
51
-
52
-
53
-
54
-
55
-
56
-
57
-
58
-
59
-
60
-
61
-
62
-
63
-
64
-
65
-
66
-
67
-
68
-
69
-
70
-
71
-
72
-
73
-
74
-
75
-
76
-
77
-
78
-
79
-
80
-
81
-
82
-
83
-
84
-
85
-
86
-
 87
87 -
 88
88 -
 89
89 -
 90
90 -
 91
91 -
 92
92 -
 93
93 -
 94
94 -
 95
95 -
 96
96 -
 97
97 -
 98
98 -
 99
99 -
 100
100 -
 101
101 -
 102
102 -
 103
103 -
 104
104 -
 105
105 -
 106
106 -
 107
107 -
108
-
109
-
110
-
111
-
112
-
113
-
114
-
115
-
116
-
117
-
118
-
119
-
120
-
121
-
122
-
123
-
124
-
125
-
126
-
127
-
128
-
129
-
130
-
131
-
132
-
133
-
134
-
135
-
136
-
137
-
138
-
139
-
140
-
141
-
142
-
143
-
144
-
145
-
146
-
147
-
148
-
149
-
150
-
151
-
152
-
153
-
154
-
155
-
156
-
157
-
158
-
159
-
160
-
161
-
162
-
163
-
164
-
165
-
166
-
167
-
168
-
169
-
170
-
171
-
172
-
173
-
174
-
175
-
176
-
177
-
178
-
179
-
180
-
181
-
182
-
183
-
184
-
185
-
186
-
187
-
188
-
189
-
190
 |
 |
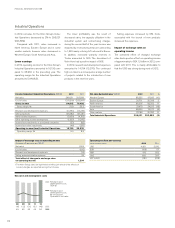
Total new financing volume in 2012 amounted to
SEK 46.6 billion (44.8). Adjusted for changes in
exchange rates, new business volume increased
by 5.3% compared to 2011 as a result of increased
penetration levels. In total, 50,994 new vehicles
and machines (49,757) from the Volvo Group were
financed during the year. In the markets where
financing is offered, the average penetration rate
was 27% (25).
As of December 31, 2012, the net credit port-
folio amounted to 99,690 (94,275). The funding
of the credit portfolio is matched in terms of
maturity, interest rates and currencies in accord-
ance with Volvo Group policy. Read more in
Note 15.
The operating income for the year amounted to
1,492 compared to 969 in the previous year.
Return on shareholders’ equity amounted to
12.5% (7.3). The equity ratio at the end of the year
amounted to 8.1% (9.1). The improvement in prof-
itability is driven mainly by higher earning assets
and good margins. During the year, credit provision
expenses amounted to 640 (682) while write-offs
of 577 (804) were recognized. The write-off ratio
for 2012 amounted to 0.58% (0.93). At the end of
December 31, 2012, credit reserves amounted to
1.23% (1.33) of the credit portfolio.
Income Statement Customer Finance, SEK M 2012 2 011
Finance and lease income 9,783 8,883
Finance and lease expenses (6,036) (5,693)
Gross income 3,747 3,190
Selling and administrative expenses (1,696) (1,618)
Credit provision expenses (640) (682)
Other operating income and expenses 81 78
Operating income (loss) 1,492 969
Income taxes (434) (323)
Income (loss) for the period 1,058 646
Return on Equity 12.5 7.3
Key ratios, Customer Finance1 2012 2011
Credit portfolio net, SEK M 99,690 94,275
Operating income, SEK M 1,492 969
Return on shareholders' equity, % 12.5 7.3
Total penetration rate, % 27 25
Penetration by business area1, %
Volvo CE 37 35
Volvo Trucks 30 27
Renault Trucks 23 19
MackTrucks 19 20
Buses 21 15
UD Trucks 13 14
1 Share of unit sales financed by Volvo Financial Services in relation to the total num-
ber units sold by the Volvo Group in markets where financial services are offered.
Customer Finance Operations
93