Volvo 2012 Annual Report Download - page 167
Download and view the complete annual report
Please find page 167 of the 2012 Volvo annual report below. You can navigate through the pages in the report by either clicking on the pages listed below, or by using the keyword search tool below to find specific information within the annual report.-
 1
1 -
2
-
3
-
4
-
5
-
6
-
7
-
8
-
9
-
10
-
11
-
12
-
13
-
14
-
15
-
16
-
17
-
18
-
19
-
20
-
21
-
22
-
23
-
24
-
25
-
26
-
27
-
28
-
29
-
30
-
31
-
32
-
33
-
34
-
35
-
36
-
37
-
38
-
39
-
40
-
41
-
42
-
43
-
44
-
45
-
46
-
47
-
48
-
49
-
50
-
51
-
52
-
53
-
54
-
55
-
56
-
57
-
58
-
59
-
60
-
61
-
62
-
63
-
64
-
65
-
66
-
67
-
68
-
69
-
70
-
71
-
72
-
73
-
74
-
75
-
76
-
77
-
78
-
79
-
80
-
81
-
82
-
83
-
84
-
85
-
86
-
87
-
88
-
89
-
90
-
91
-
92
-
93
-
94
-
95
-
96
-
97
-
98
-
99
-
100
-
101
-
102
-
103
-
104
-
105
-
106
-
107
-
108
-
109
-
110
-
111
-
112
-
113
-
114
-
115
-
116
-
117
-
118
-
119
-
120
-
121
-
122
-
123
-
124
-
125
-
126
-
127
-
128
-
129
-
130
-
131
-
132
-
133
-
134
-
135
-
136
-
137
-
138
-
139
-
140
-
141
-
142
-
143
-
144
-
145
-
146
-
147
-
148
-
149
-
150
-
151
-
152
-
153
-
154
-
155
-
156
-
 157
157 -
 158
158 -
 159
159 -
 160
160 -
 161
161 -
 162
162 -
 163
163 -
 164
164 -
 165
165 -
 166
166 -
 167
167 -
 168
168 -
 169
169 -
 170
170 -
 171
171 -
 172
172 -
 173
173 -
 174
174 -
 175
175 -
 176
176 -
 177
177 -
178
-
179
-
180
-
181
-
182
-
183
-
184
-
185
-
186
-
187
-
188
-
189
-
190
 |
 |

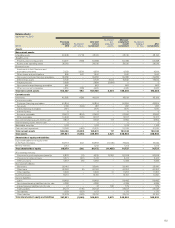
CHANGES IN SHAREHOLDERS’ EQUITY
Restricted equity Unrestricted equity
SEK M Share
capital Statutory
reserve
Share
premium
reserve Fair value
reserve Retained
earnings Total
Total
shareholders’
equity
Balance at December 31, 2010 2,554 7,3 37 190 193 31,579 31,962 41,853
Income for the period – – – – 5,481 5,481 5,481
Other comprehensive income
Available-for-sale investments:
Gain/(loss) at valuation to fair value – – – (159) –(159) (159)
Other comprehensive income – – – (159) –(159) (159)
Total income for the period – – – (159) 5,481 5,322 5,322
Transactions with shareholders
Dividend to AB Volvo's shareholders – – – – (5,069) (5,069) (5,069)
Share-based payments – – 0 – 53 53 53
Transactions with shareholders – – 0 – (5,016) (5,016) (5,016)
Balance at December 31, 2011 2,554 7, 337 190 34 32,044 32,268 42,159
Income for the period – – – – 5,101 5,101 5,101
Other comprehensive income
Available-for-sale investments:
Gain/(loss) at valuation to fair value – – – (34) –(34) (34)
Other comprehensive income – – – (34) –(34) (34)
Total income for the period – – – (34) –5,067 5,067
Transactions with shareholders
Dividend to AB Volvo's shareholders – – – – (6,083) (6,083) (6,083)
Share-based payments – – 14 –80 94 94
Transactions with shareholders – – 14 –(6,003) (5,989) (5,989)
Balance at December 31, 2012 2,554 7, 337 204 –31,142 31,346 41,237
Further information regarding the share capital of the Parent Company is shown in Note 19 to the consolidated financial statements.
163