Volvo 2012 Annual Report Download - page 63
Download and view the complete annual report
Please find page 63 of the 2012 Volvo annual report below. You can navigate through the pages in the report by either clicking on the pages listed below, or by using the keyword search tool below to find specific information within the annual report.-
 1
1 -
2
-
3
-
4
-
5
-
6
-
7
-
8
-
9
-
10
-
11
-
12
-
13
-
14
-
15
-
16
-
17
-
18
-
19
-
20
-
21
-
22
-
23
-
24
-
25
-
26
-
27
-
28
-
29
-
30
-
31
-
32
-
33
-
34
-
35
-
36
-
37
-
38
-
39
-
40
-
41
-
42
-
43
-
44
-
45
-
46
-
47
-
48
-
49
-
50
-
51
-
52
-
 53
53 -
 54
54 -
 55
55 -
 56
56 -
 57
57 -
 58
58 -
 59
59 -
 60
60 -
 61
61 -
 62
62 -
 63
63 -
 64
64 -
 65
65 -
 66
66 -
 67
67 -
 68
68 -
 69
69 -
 70
70 -
 71
71 -
 72
72 -
 73
73 -
74
-
75
-
76
-
77
-
78
-
79
-
80
-
81
-
82
-
83
-
84
-
85
-
86
-
87
-
88
-
89
-
90
-
91
-
92
-
93
-
94
-
95
-
96
-
97
-
98
-
99
-
100
-
101
-
102
-
103
-
104
-
105
-
106
-
107
-
108
-
109
-
110
-
111
-
112
-
113
-
114
-
115
-
116
-
117
-
118
-
119
-
120
-
121
-
122
-
123
-
124
-
125
-
126
-
127
-
128
-
129
-
130
-
131
-
132
-
133
-
134
-
135
-
136
-
137
-
138
-
139
-
140
-
141
-
142
-
143
-
144
-
145
-
146
-
147
-
148
-
149
-
150
-
151
-
152
-
153
-
154
-
155
-
156
-
157
-
158
-
159
-
160
-
161
-
162
-
163
-
164
-
165
-
166
-
167
-
168
-
169
-
170
-
171
-
172
-
173
-
174
-
175
-
176
-
177
-
178
-
179
-
180
-
181
-
182
-
183
-
184
-
185
-
186
-
187
-
188
-
189
-
190
 |
 |

Net sales
SEK bn
1211100908
192.3
198.9 192.3167.3138.9203.6
Operating income (loss)
and operating margin
SEK M
%
10,216
11
18,227
9.2
12
10,216
5.3
10
10,112
6.0
09
(10,805)
(7.8)
08
12,167
6.0
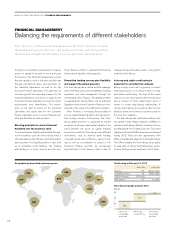
Net sales by market
SEK M 2012 2 011
Europe 76,365 83,451
North America 42,650 37,042
South America 21,172 26,847
Asia 36,531 37,840
Other markets 15,565 13,741
Total 192,283 198,920
Deliveries by market
Number of
trucks 2012 2 011
Europe 84,355 95.113
North America 47,806 42.613
South America 23,443 29.274
Asia 51,514 56.165
Other markets 16,899 15.226
Total 224,017 238.391
12111211
10.3 10.115.616.0
Volvo Renault Trucks
Market shares
in Europe,
heavy-duty trucks
12111211
6.8 7.910.411.4
Volvo Mack
Market shares
in North America,
heavy-duty trucks
1211
17.520.1
UD Trucks
Market shares
in Japan,
heavy-duty trucks
Volvo VM
The Volvo VM is a truck developed spe-
cifically for the South American market,
where it is used for regional transports
and city distribution.
Continued
product renewal
59