Volvo 2012 Annual Report Download - page 102
Download and view the complete annual report
Please find page 102 of the 2012 Volvo annual report below. You can navigate through the pages in the report by either clicking on the pages listed below, or by using the keyword search tool below to find specific information within the annual report.-
 1
1 -
2
-
3
-
4
-
5
-
6
-
7
-
8
-
9
-
10
-
11
-
12
-
13
-
14
-
15
-
16
-
17
-
18
-
19
-
20
-
21
-
22
-
23
-
24
-
25
-
26
-
27
-
28
-
29
-
30
-
31
-
32
-
33
-
34
-
35
-
36
-
37
-
38
-
39
-
40
-
41
-
42
-
43
-
44
-
45
-
46
-
47
-
48
-
49
-
50
-
51
-
52
-
53
-
54
-
55
-
56
-
57
-
58
-
59
-
60
-
61
-
62
-
63
-
64
-
65
-
66
-
67
-
68
-
69
-
70
-
71
-
72
-
73
-
74
-
75
-
76
-
77
-
78
-
79
-
80
-
81
-
82
-
83
-
84
-
85
-
86
-
87
-
88
-
89
-
90
-
91
-
 92
92 -
 93
93 -
 94
94 -
 95
95 -
 96
96 -
 97
97 -
 98
98 -
 99
99 -
 100
100 -
 101
101 -
 102
102 -
 103
103 -
 104
104 -
 105
105 -
 106
106 -
 107
107 -
 108
108 -
 109
109 -
 110
110 -
 111
111 -
 112
112 -
113
-
114
-
115
-
116
-
117
-
118
-
119
-
120
-
121
-
122
-
123
-
124
-
125
-
126
-
127
-
128
-
129
-
130
-
131
-
132
-
133
-
134
-
135
-
136
-
137
-
138
-
139
-
140
-
141
-
142
-
143
-
144
-
145
-
146
-
147
-
148
-
149
-
150
-
151
-
152
-
153
-
154
-
155
-
156
-
157
-
158
-
159
-
160
-
161
-
162
-
163
-
164
-
165
-
166
-
167
-
168
-
169
-
170
-
171
-
172
-
173
-
174
-
175
-
176
-
177
-
178
-
179
-
180
-
181
-
182
-
183
-
184
-
185
-
186
-
187
-
188
-
189
-
190
 |
 |

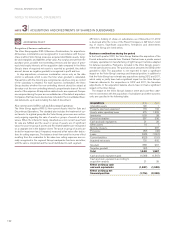
CHANGES IN CONSOLIDATED SHAREHOLDERS’ EQUITY
Shareholders’ equity attributable to equity holders of
the Parent Company
SEK M Share
capital Other
reserves1Translation
reserve Retained
earnings Total Minority
interests Total
equity
Balance at December 31, 2010 2,554 115 2,271 6 8,170 73 ,110 1, 011 74,121
Income for the period – – – 17,751 17,751 364 18 ,115
Other comprehensive income
Translation differences on foreign operations – – (1,062) –(1,062) 82 (980)
Translation differences on hedge instruments of net
investments in foreign operations – – (3) –(3) –(3)
Accumulated translation differences reversed
to income – – (30) –(30) –(30)
Available-for-sale investments: Note 5, 19
Gains/losses at valuation to fair value – 39 – – 39 –39
Change in cash flow hedge reserve Note 19 –(144) – – (144) –(144)
Other comprehensive income for the period – (105) (1,095) –(1,200) 82 (1,118)
Total income for the period –(105) (1,095) 17,751 16,551 446 16,997
Transactions with shareholders
Dividends to shareholders – – – (5,069) (5,069) (2) (5,071)
Transactions with minority interests – – – (67) (67) –(67)
Share based payments Note 27 – – – 57 57 –57
Changes in minority interests – – – – – (356) (356)
Other changes – – – (1) (1) 1(0)
Transactions with shareholders – – – (5,080) (5,080) (357) (5,437)
Balance at December 31, 2011 2,554 10 1,176 80,841 84,581 1,100 85,681
Income for the period – – – 11, 0 39 11, 039 219 11, 2 58
Other comprehensive income
Translation differences on foreign operations – – (3,859) – (3,859) (57) (3,916)
Translation differences on hedge instruments of net
investments in foreign operations – – – – – – –
Accumulated translation differences reversed
to income – – (118) – (118) – (118)
Available-for-sale investments: Note 5,19
Gains/losses at valuation to fair value – (4) – – (4) – (4)
Change in cash flow hedge reserve Note 19 – 8 – – 8 – 8
Other comprehensive income for the period – 4 (3,977) – (3,973) (57) (4,030)
Total income for the period – 4 (3,977) 11, 039 7,06 6 162 7,228
Transactions with shareholders
Dividends to shareholders – – – (6,083) (6,083) – (6,083)
Transactions with minority interests – – – – – – –
Share based payments Note 27 – – – 90 90 – 90
Changes in minority interests – – – – – – –
Other changes – – – (6) (6) 4 (2)
Transactions with shareholders – – – (5,999) (5,999) 4 (5,995)
Balance at December 31, 2012 2,554 14 (2,801) 85,881 85,648 1,266 86 ,914
1 For specification of other reserves, see Note 19.
FINANCIAL INFORMATION 2012
98