Volvo 2012 Annual Report Download - page 133
Download and view the complete annual report
Please find page 133 of the 2012 Volvo annual report below. You can navigate through the pages in the report by either clicking on the pages listed below, or by using the keyword search tool below to find specific information within the annual report.-
 1
1 -
2
-
3
-
4
-
5
-
6
-
7
-
8
-
9
-
10
-
11
-
12
-
13
-
14
-
15
-
16
-
17
-
18
-
19
-
20
-
21
-
22
-
23
-
24
-
25
-
26
-
27
-
28
-
29
-
30
-
31
-
32
-
33
-
34
-
35
-
36
-
37
-
38
-
39
-
40
-
41
-
42
-
43
-
44
-
45
-
46
-
47
-
48
-
49
-
50
-
51
-
52
-
53
-
54
-
55
-
56
-
57
-
58
-
59
-
60
-
61
-
62
-
63
-
64
-
65
-
66
-
67
-
68
-
69
-
70
-
71
-
72
-
73
-
74
-
75
-
76
-
77
-
78
-
79
-
80
-
81
-
82
-
83
-
84
-
85
-
86
-
87
-
88
-
89
-
90
-
91
-
92
-
93
-
94
-
95
-
96
-
97
-
98
-
99
-
100
-
101
-
102
-
103
-
104
-
105
-
106
-
107
-
108
-
109
-
110
-
111
-
112
-
113
-
114
-
115
-
116
-
117
-
118
-
119
-
120
-
121
-
122
-
 123
123 -
 124
124 -
 125
125 -
 126
126 -
 127
127 -
 128
128 -
 129
129 -
 130
130 -
 131
131 -
 132
132 -
 133
133 -
 134
134 -
 135
135 -
 136
136 -
 137
137 -
 138
138 -
 139
139 -
 140
140 -
 141
141 -
 142
142 -
 143
143 -
144
-
145
-
146
-
147
-
148
-
149
-
150
-
151
-
152
-
153
-
154
-
155
-
156
-
157
-
158
-
159
-
160
-
161
-
162
-
163
-
164
-
165
-
166
-
167
-
168
-
169
-
170
-
171
-
172
-
173
-
174
-
175
-
176
-
177
-
178
-
179
-
180
-
181
-
182
-
183
-
184
-
185
-
186
-
187
-
188
-
189
-
190
 |
 |

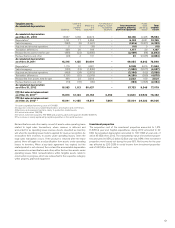
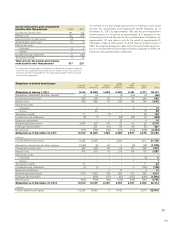
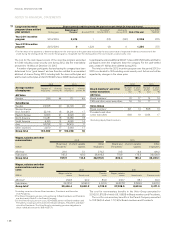
Obligations in defined-benefit plans Sweden
Pensions US
Pensions France
Pensions
Great
Britain
Pensions
US
Other
benefits Other
plans Total
Obligations at January 1, 2011 9,144 12,998 1,605 4,226 3,441 4,707 36,121
Acquisitions, divestments and other changes (1) (2) 1(2) (59) (3) (66)
Current year service costs 246 295 52 31 74 255 953
Interest costs 435 582 70 226 144 145 1,602
Past service costs
– Unvested – 4 – – 9 1 14
– Vested –40 –––18 58
Termination benefits 77 –(1) – – 26 102
Curtailments and settlements (8) (1) –(69) (44) (7) (129)
Employee contributions – – – 12 – 4 16
Actuarial (gains) and losses 2,434 925 136 52 115 39 3,701
Exchange rate translation –301 (12) 54 66 58 467
Benefits paid (315) (782) (86) (161) (169) (968) (2,481)
Obligations as of December 31, 2011 12,012 14,360 1,765 4,369 3,577 4,275 40,358
of which
Funded defined-benefit plans 11, 624 13,925 –4,369 –1, 817 31,735
Acquisitions, divestments and other changes (1,362) (9) 84 0(3) (45) (1,335)
Current year service costs 442 299 59 22 131 259 1,212
Interest costs 419 576 78 215 138 131 1,557
Past service costs – – – – – – –
– Unvested – – 1 – – (1) 0
– Vested – – – – 1 – 1
Termination benefits 21 – – – – 11 32
Curtailments and settlements (7) (1) – – 2 (122) (128)
Employee contributions – – 1 10 – 3 14
Actuarial (gains) and losses 1,315 1,546 169 390 312 382 4,114
Exchange rate translation –(879) (67) (81) (237) (298) (1,562)
Benefits paid (330) (763) (88) (185) (184) (241) (1,791)
Obligations as of December 31, 2012 12,510 15,129 2,002 4,740 3,737 4,354 42,472
of which
Funded defined-benefit plans 10,934 14,645 6 4,740 – 2,675 33,000
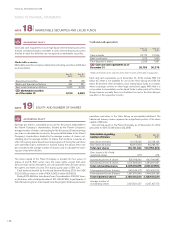
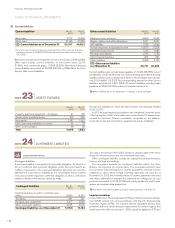
Costs for the period, post–employment
benefits other than pensions 2012 2 011
Current year service costs 141 85
Interest costs 142 148
Expected return on plan assets (2) –
Actuarial gains and losses119 9
Past service costs
– Unvested 4 5
– Vested 1 –
Curtailments and settlements 6(35)
Termination benefits 625
Total costs for the period, post–employ-
ment benefits other than pensions 317 237
1 For each plan, actuarial gains and losses are reported as income or expense
when the accumulated amount exceed the so called corridor. The income or
expenses are then recognized over the expected average remaining service
period of the employees.
An increase of one percentage point per year in healthcare costs would
increase the accumulated post–employment benefit obligation as of
December 31, 2012 by approximately 166, and the post–employment
benefit expense for the period by approximately 8. A decrease of one
percentage point would decrease the accumulated value of obligations by
approximately 141 and reduce costs for the period by approximately 6.
Calculations made as of December 31, 2012 show an annual increase of
8% in the weighted average per capita costs of covered health care bene-
fits. It is assumed that the percentage will decline gradually to 4.5% until
2029 and subsequently remain at that level.
129