Volvo 2012 Annual Report Download - page 96
Download and view the complete annual report
Please find page 96 of the 2012 Volvo annual report below. You can navigate through the pages in the report by either clicking on the pages listed below, or by using the keyword search tool below to find specific information within the annual report.-
 1
1 -
2
-
3
-
4
-
5
-
6
-
7
-
8
-
9
-
10
-
11
-
12
-
13
-
14
-
15
-
16
-
17
-
18
-
19
-
20
-
21
-
22
-
23
-
24
-
25
-
26
-
27
-
28
-
29
-
30
-
31
-
32
-
33
-
34
-
35
-
36
-
37
-
38
-
39
-
40
-
41
-
42
-
43
-
44
-
45
-
46
-
47
-
48
-
49
-
50
-
51
-
52
-
53
-
54
-
55
-
56
-
57
-
58
-
59
-
60
-
61
-
62
-
63
-
64
-
65
-
66
-
67
-
68
-
69
-
70
-
71
-
72
-
73
-
74
-
75
-
76
-
77
-
78
-
79
-
80
-
81
-
82
-
83
-
84
-
85
-
 86
86 -
 87
87 -
 88
88 -
 89
89 -
 90
90 -
 91
91 -
 92
92 -
 93
93 -
 94
94 -
 95
95 -
 96
96 -
 97
97 -
 98
98 -
 99
99 -
 100
100 -
 101
101 -
 102
102 -
 103
103 -
 104
104 -
 105
105 -
 106
106 -
107
-
108
-
109
-
110
-
111
-
112
-
113
-
114
-
115
-
116
-
117
-
118
-
119
-
120
-
121
-
122
-
123
-
124
-
125
-
126
-
127
-
128
-
129
-
130
-
131
-
132
-
133
-
134
-
135
-
136
-
137
-
138
-
139
-
140
-
141
-
142
-
143
-
144
-
145
-
146
-
147
-
148
-
149
-
150
-
151
-
152
-
153
-
154
-
155
-
156
-
157
-
158
-
159
-
160
-
161
-
162
-
163
-
164
-
165
-
166
-
167
-
168
-
169
-
170
-
171
-
172
-
173
-
174
-
175
-
176
-
177
-
178
-
179
-
180
-
181
-
182
-
183
-
184
-
185
-
186
-
187
-
188
-
189
-
190
 |
 |

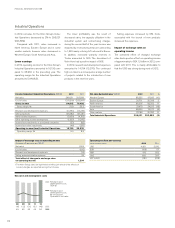
In 2012, net sales for the Volvo Group’s Indus-
trial Operations decreased by 2% to 296,031
(303,589).
Compared with 2011, sales increased in
North America, Eastern Europe and in some
smaller markets, however sales decreased in
Western Europe, South America and Asia.
Lower earnings
In 2012, operating income for the Volvo Group’s
Industrial Operations amounted to 16,130 com-
pared to 25,930 in the preceding year. The
operating margin for the Industrial Operations
amounted to 5.4% (8.5).
The lower profitability was the result of
decreased sales, low capacity utilization in the
industrial system and restructuring charges
during the second half of the year. Income was
impacted by restructuring measures amounting
to 1,524 mainly refering to Trucks and to Buses.
In addition, increased warranty reserves in
Trucks amounted to 500. The divestment of
Volvo Aero had a positive impact of 568.
In 2012, research and development expenses
amounted to 14,794 (13,276). The continued
high cost level is a consequence a large number
of projects related to the introduction of new
products in the next few years.
Selling expenses increased by 6%. Costs
associated with the launch of new products
increased the expenses.
Impact of exchange rates on
operating income
The combined effect of changed exchange
rates had a positive effect on operating income
of approximately to SEK 1.3 billion in 2012, com-
pared with 2011. This is mainly attributable to
that the USD was strong during most of 2012.
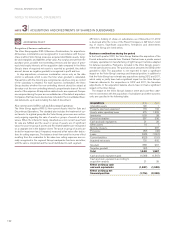
Income Statement Industrial Operations, SEK M 2012 2011
Net sales 296,031 303,589
Cost of sales (231,216) (233,097)
Gross income 64,815 70,492
Gross margin, % 21.9 23.2
Research and development expenses (14,794) (13,276)
Selling expenses (26,582) (25,181)
Administrative expenses (5,639) (4,753)
Other operating income and expenses (1,600) (1,045)
Income from investments in associated companies (23) (82)
Income from other investments (46) (225)
Operating income (loss) Industrial Operations 16,130 25,930
Operating margin, % 5.4 8.5
Impact of exchange rates on operating income
Compared with preceding year, SEK M
Net sales11,904
Cost of sales (610)
Research and development expenses (15)
Selling and administrative expenses 25
Total effect of changes in exchange rates
on operating income 1,304
1 The Volvo Group sales are reported at monthly spot rates and the effects of
currency hedges are reported among Cost of sales.
Operating net flow per currency
Local currency, million 2012 2 011
USD 4,421 3,970
EUR (158) 57
GBP 472 555
CAD 600 397
JPY (x100) (181) (218)
Net sales by market area, SEK M 2012 2 011 %
Western Europe 88,325 97,925 (10)
Eastern Europe 20,751 20,298 2
North America 68,297 58,253 17
South America 27,970 34,013 (18)
Asia 68,500 73 ,017 (6)
Other markets 22,188 20,083 10
Total Industrial Operations 296,031 303,589 (2)
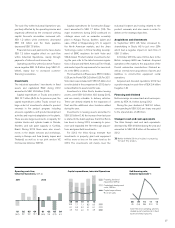
Research and development costs
1211100908
13.313.013.214.3
4.4
14.8
5.05.06.34.9
Research and
development costs,
SEK bn
Research and
development costs,
% of Industrial
Operations' net sales
Industrial Operations
92
FINANCIAL INFORMATION 2012