Volvo 2012 Annual Report Download - page 157
Download and view the complete annual report
Please find page 157 of the 2012 Volvo annual report below. You can navigate through the pages in the report by either clicking on the pages listed below, or by using the keyword search tool below to find specific information within the annual report.-
 1
1 -
2
-
3
-
4
-
5
-
6
-
7
-
8
-
9
-
10
-
11
-
12
-
13
-
14
-
15
-
16
-
17
-
18
-
19
-
20
-
21
-
22
-
23
-
24
-
25
-
26
-
27
-
28
-
29
-
30
-
31
-
32
-
33
-
34
-
35
-
36
-
37
-
38
-
39
-
40
-
41
-
42
-
43
-
44
-
45
-
46
-
47
-
48
-
49
-
50
-
51
-
52
-
53
-
54
-
55
-
56
-
57
-
58
-
59
-
60
-
61
-
62
-
63
-
64
-
65
-
66
-
67
-
68
-
69
-
70
-
71
-
72
-
73
-
74
-
75
-
76
-
77
-
78
-
79
-
80
-
81
-
82
-
83
-
84
-
85
-
86
-
87
-
88
-
89
-
90
-
91
-
92
-
93
-
94
-
95
-
96
-
97
-
98
-
99
-
100
-
101
-
102
-
103
-
104
-
105
-
106
-
107
-
108
-
109
-
110
-
111
-
112
-
113
-
114
-
115
-
116
-
117
-
118
-
119
-
120
-
121
-
122
-
123
-
124
-
125
-
126
-
127
-
128
-
129
-
130
-
131
-
132
-
133
-
134
-
135
-
136
-
137
-
138
-
139
-
140
-
141
-
142
-
143
-
144
-
145
-
146
-
 147
147 -
 148
148 -
 149
149 -
 150
150 -
 151
151 -
 152
152 -
 153
153 -
 154
154 -
 155
155 -
 156
156 -
 157
157 -
 158
158 -
 159
159 -
 160
160 -
 161
161 -
 162
162 -
 163
163 -
 164
164 -
 165
165 -
 166
166 -
 167
167 -
168
-
169
-
170
-
171
-
172
-
173
-
174
-
175
-
176
-
177
-
178
-
179
-
180
-
181
-
182
-
183
-
184
-
185
-
186
-
187
-
188
-
189
-
190
 |
 |

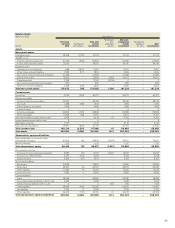
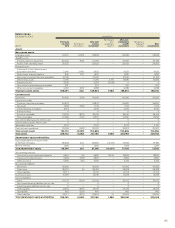
Balance sheets
September 30, 2012 Volvo Group
SEK M
Previously
reported
2012
Restatement
joint ventures
After joint
venture
restatement
Restatement
post-
employment
benefits
After post-
employment
benefit
restatement
Restatement
hedging of
firm flows
After
restatements
Assets
Non-current assets
Intangible assets 39,908 (1,713) 38,195 –38,195 –38,195
Tangible assets
Property, plant and equipment 54,277 (789) 53,488 –53,488 –53,488
Assets under operating leases 26,516 –26 ,516 –26,516 –26,516
Financial assets
Investments in Joint Venturesand
associated companies 2,020 2,539 4,559 –4,559 –4,559
Other shares and participations 899 641 1,540 –1,540 –1,540
Non-current customer-financing receivables 39,082 –39,082 –39,082 –39,082
Deferred tax assets 11, 73 9 –11, 7 3 9 5,103 16,842 –16,842
Prepaid pensions 2,699 –2,699 (2,699) 0 – 0
Non-current interest-bearing receivables 667 –667 –667 –667
Other non-current receivables 4,650 (185) 4,465 –4,465 –4,465
Total non-current assets 182,457 493 182,950 2,404 185,354 –185,354
Current assets
Inventories 45,585 (426) 45,159 –45,159 –45,159
Current receivables
Customer-financing receivables 40,804 –40,804 –40,804 –40,804
Tax assets 1,180 (193) 987 –987 –987
Interest-bearing receivables 1,671 –1,671 –1,671 –1,671
Internal funding 0 – 0 – 0 – 0
Accounts receivable 28,427 (834) 27,593 –27,593 –27, 593
Other receivables 14,646 (129) 14,517 –14, 517 –14,517
Non interest-bearing assets held for sale 9,847 –9,847 117 9,964 –9,964
Interest-bearing assets held for sale 0 – 0 – 0 – 0
Marketable securities 1,122 –1,122 –1,122 –1,122
Cash and cash equivalents 21,782 (452) 21,330 –21,330 –21,330
Total current assets 165,064 (2,033) 163,031 117 163,148 –163,148
Total assets 347, 521 (1,540) 345,981 2,521 348,502 –348,502
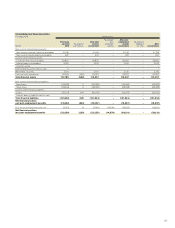
Shareholders’ equity and liabilities
Equity attributable to the equity holder
of the Parent Company 84,757 202 84,959 (11, 4 3 5 ) 73,524 –73,524
Minority interests 1,213 –1,213 –1,213 –1,213
Total shareholders’ equity 85,970 202 86,172 (11,435) 74,737 –74,737
Non-current provisions
Provisions for post-employment benefits 6,832 (17) 6,815 13,393 20,208 –20,208
Provisions for deferred taxes 5,573 (161) 5,412 –5,412 –5,412
Other provisions 5,557 (74) 5,483 –5,483 –5,483
Non-current liabilities
Bond loans 35,441 –35,441 –35,441 –35,441
Other loans 40,362 (5) 40,357 –40,357 –40,357
Other liabilities 11, 2 26 –11, 2 26 31 11, 2 57 –11, 2 57
Current provisions 10,741 –10,741 –10,741 –10,741
Current liabilities
Loans 59,482 –59,482 –59,482 –59,482
Non interest-bearing liabilities held for sale 4,386 –4,386 –4,386 –4,386
Interest-bearing liabilities held for sale 47 –47 532 579 –579
Trade payables 47,317 (770) 46,547 –46,547 –46,547
Tax liabilities 1,359 (187) 1,172 –1,172 –1,172
Other liabilities 33,228 (528) 32,700 –32,700 –32,700
Total shareholders’ equity and liabilities 3 47, 521 (1,540) 345,981 2,521 348,502 –348,502
153