Volvo 2012 Annual Report Download - page 156
Download and view the complete annual report
Please find page 156 of the 2012 Volvo annual report below. You can navigate through the pages in the report by either clicking on the pages listed below, or by using the keyword search tool below to find specific information within the annual report.-
 1
1 -
2
-
3
-
4
-
5
-
6
-
7
-
8
-
9
-
10
-
11
-
12
-
13
-
14
-
15
-
16
-
17
-
18
-
19
-
20
-
21
-
22
-
23
-
24
-
25
-
26
-
27
-
28
-
29
-
30
-
31
-
32
-
33
-
34
-
35
-
36
-
37
-
38
-
39
-
40
-
41
-
42
-
43
-
44
-
45
-
46
-
47
-
48
-
49
-
50
-
51
-
52
-
53
-
54
-
55
-
56
-
57
-
58
-
59
-
60
-
61
-
62
-
63
-
64
-
65
-
66
-
67
-
68
-
69
-
70
-
71
-
72
-
73
-
74
-
75
-
76
-
77
-
78
-
79
-
80
-
81
-
82
-
83
-
84
-
85
-
86
-
87
-
88
-
89
-
90
-
91
-
92
-
93
-
94
-
95
-
96
-
97
-
98
-
99
-
100
-
101
-
102
-
103
-
104
-
105
-
106
-
107
-
108
-
109
-
110
-
111
-
112
-
113
-
114
-
115
-
116
-
117
-
118
-
119
-
120
-
121
-
122
-
123
-
124
-
125
-
126
-
127
-
128
-
129
-
130
-
131
-
132
-
133
-
134
-
135
-
136
-
137
-
138
-
139
-
140
-
141
-
142
-
143
-
144
-
145
-
 146
146 -
 147
147 -
 148
148 -
 149
149 -
 150
150 -
 151
151 -
 152
152 -
 153
153 -
 154
154 -
 155
155 -
 156
156 -
 157
157 -
 158
158 -
 159
159 -
 160
160 -
 161
161 -
 162
162 -
 163
163 -
 164
164 -
 165
165 -
 166
166 -
167
-
168
-
169
-
170
-
171
-
172
-
173
-
174
-
175
-
176
-
177
-
178
-
179
-
180
-
181
-
182
-
183
-
184
-
185
-
186
-
187
-
188
-
189
-
190
 |
 |

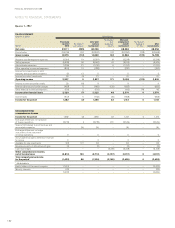
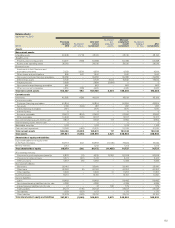
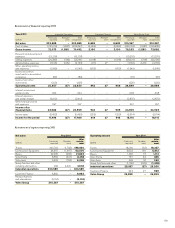
Income statement
Quarter 3, 2012 Volvo Group
SEK M
Previously
reported
2012
Restatement
joint ventures
After joint
venture
restatement
Restatement
post-
employment
benefits
After post-
employment
benefit
restatement
Restatement
hedging of
firm flows
After
restatements
Net sales 69,111 (855) 68,256 –68,256 –68,256
Cost of sales (54,136) 743 (53,393) 103 (53,290) (178) (53,468)
Gross income 14,975 (112) 14,863 103 14,966 (178) 14,788
Research and development expenses (3,316) 19 (3,297) 19 (3,278) –(3,278)
Selling expenses (6,608) 46 (6,562) 43 (6,519) –(6, 519)
Administrative expenses (1,336) 21 (1,315) 5(1,310) –(1,310)
Other operating income and expenses (803) 15 (788) 1(787) –(787)
Income from investments in Joint
Venturesand associated companies (7) 12 5 – 5 – 5
Income from other investments 23 (2) 21 –21 –21
Operating income 2,927 02,927 171 3,098 (178) 2,920
Interest income and similar credits 22 (13) 9 – 9 – 9
Interest expenses and similar charges (487) 5(482) (123) (605) –(605)
Other financial income and expenses (133) 0(133) –(133) 178 45
Income after financial items 2,329 (7) 2,322 48 2,370 02,370
Income taxes (947) 5(942) (16) (958) –(958)
Income for the period 1,382 (2) 1,380 32 1,412 01,412
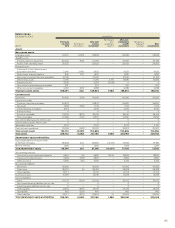
Consolidated other
comprehensive income
Income for the period 1,382 (2) 1,380 32 1,412 01,412
Exchange differences on translation
of foreign operations (2,774) 4(2,778) 221 (2,549) –(2,549)
Share of OCI related to Joint Ventrues and
associated companies –(5) (5) –(5) –(5)
Exchange differences on hedge
instruments of net investment
in foreign operations 0 – 0 – 0 – 0
Accumulated translation difference reversed
to income 0 – 0 – 0 – 0
Available for sale investments (37) 101 64 –64 –64
Remeasurements of defined benefit plan (3) –(3) –(3) –(3)
Cash flow hedges – – – (2,418) (2,418) –(2,418)
Other comprehensive income,
net of income taxes (2,814) 100 (2,714) (2,197) (4,911) 0(4,911)
Total comprehensive income
for the period* (1,432) 98 (1,334) (2,165) (3,499) 0(3,499)
* Attributable to
Equity holders of the parent company (1,410) – – – – – (3,477)
Minority interests (22) –––––(22)
(1,432) – – – – – (3,499)
Quarter 3, 2012
NOTES TO FINANCIAL STATEMENTS
FINANCIAL INFORMATION 2012
152