Volvo 2012 Annual Report Download - page 142
Download and view the complete annual report
Please find page 142 of the 2012 Volvo annual report below. You can navigate through the pages in the report by either clicking on the pages listed below, or by using the keyword search tool below to find specific information within the annual report.-
 1
1 -
2
-
3
-
4
-
5
-
6
-
7
-
8
-
9
-
10
-
11
-
12
-
13
-
14
-
15
-
16
-
17
-
18
-
19
-
20
-
21
-
22
-
23
-
24
-
25
-
26
-
27
-
28
-
29
-
30
-
31
-
32
-
33
-
34
-
35
-
36
-
37
-
38
-
39
-
40
-
41
-
42
-
43
-
44
-
45
-
46
-
47
-
48
-
49
-
50
-
51
-
52
-
53
-
54
-
55
-
56
-
57
-
58
-
59
-
60
-
61
-
62
-
63
-
64
-
65
-
66
-
67
-
68
-
69
-
70
-
71
-
72
-
73
-
74
-
75
-
76
-
77
-
78
-
79
-
80
-
81
-
82
-
83
-
84
-
85
-
86
-
87
-
88
-
89
-
90
-
91
-
92
-
93
-
94
-
95
-
96
-
97
-
98
-
99
-
100
-
101
-
102
-
103
-
104
-
105
-
106
-
107
-
108
-
109
-
110
-
111
-
112
-
113
-
114
-
115
-
116
-
117
-
118
-
119
-
120
-
121
-
122
-
123
-
124
-
125
-
126
-
127
-
128
-
129
-
130
-
131
-
 132
132 -
 133
133 -
 134
134 -
 135
135 -
 136
136 -
 137
137 -
 138
138 -
 139
139 -
 140
140 -
 141
141 -
 142
142 -
 143
143 -
 144
144 -
 145
145 -
 146
146 -
 147
147 -
 148
148 -
 149
149 -
 150
150 -
 151
151 -
 152
152 -
153
-
154
-
155
-
156
-
157
-
158
-
159
-
160
-
161
-
162
-
163
-
164
-
165
-
166
-
167
-
168
-
169
-
170
-
171
-
172
-
173
-
174
-
175
-
176
-
177
-
178
-
179
-
180
-
181
-
182
-
183
-
184
-
185
-
186
-
187
-
188
-
189
-
190
 |
 |
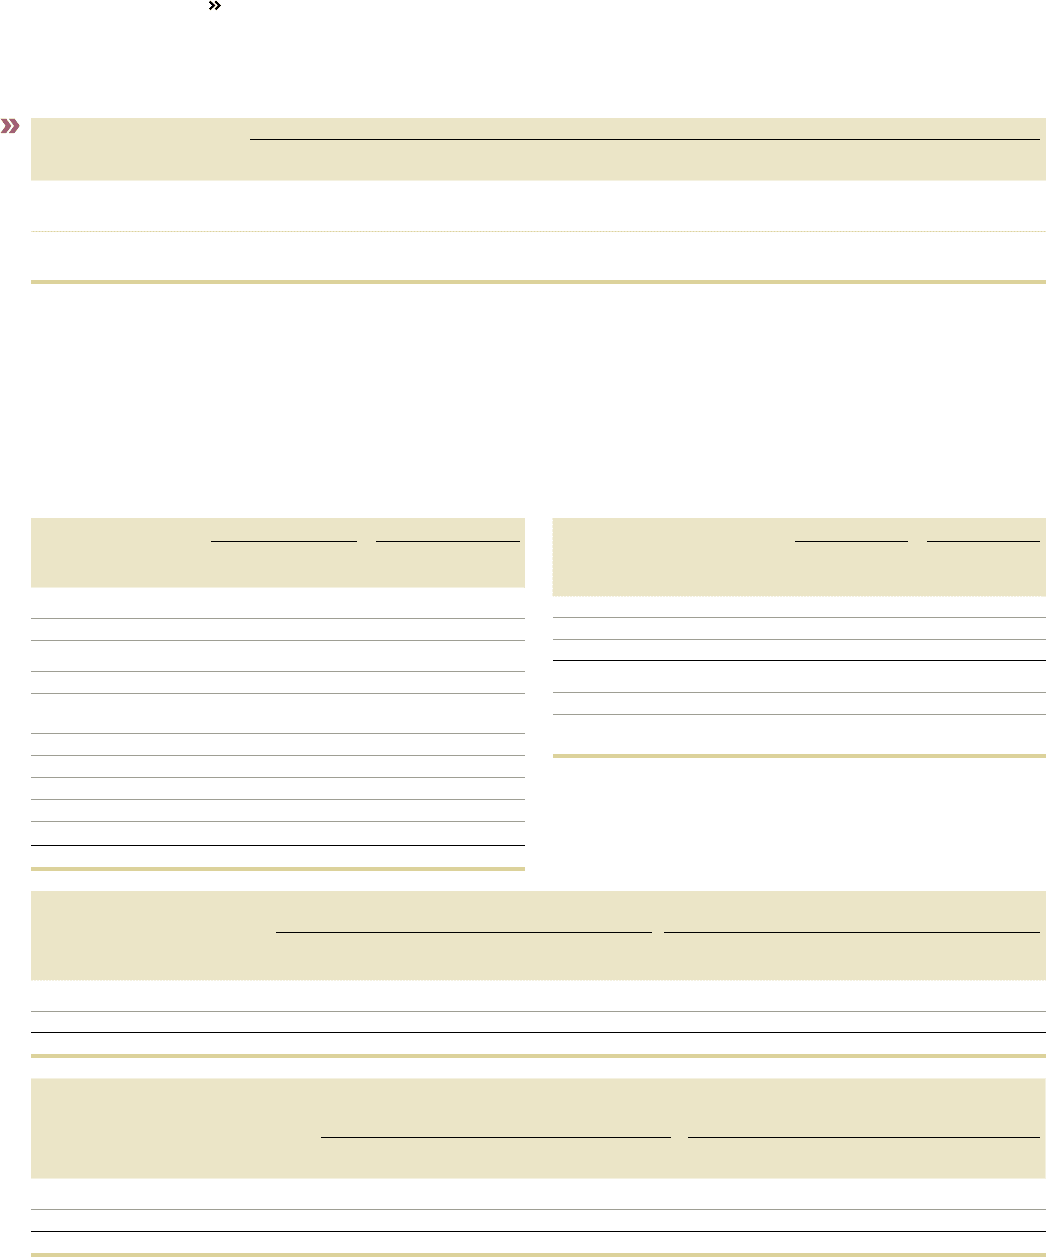
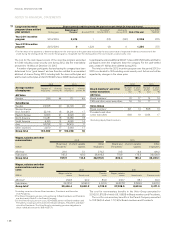
Long term incentive
program (share settled
plan version)
Shares granted conditional under the plan but not yet alloted (in thousand shares)
Vesting year Beginning of
the year Granted 2012 Cancelled/
forfeited 2012 Allotments
during 2012 End of the year Cost 2012
(SEK M)1
Year 2011 incentive
program 2014/2015 2,476 1(18) (251) 2,208 87.5
Year 2012 incentive
program 2015/2016 0 1,324 (4) 01,320 37.5
1 The fair value of the payments is determined based on the share price at the grant date reduced by the discounted value of expected dividends connected with the
share during the vesting period. The cost for the program is recognized over the vesting period. The cost includes social security cost.
Wages, salaries and other
remunerations 2012 2011
SEK M
Board and
Presidents1
of which variable
salaries
Other
employees
Board and
Presidents1
of which variable
salaries
Other
employees
AB Volvo 24.6 5.1 270.2 31.5 9.9 199.2
Subsidiaries 745.3 109.2 38,406.3 770.9 175.5 36,036.9
Group total 769.9 114.3 38,676.5 802.4 185.4 36,236.1
Wages, salaries and other
remunerations and social
costs 2012 2 011
SEK M Wages, salaries
remun Social costs Pension
costs Wages, salaries
remun Social costs Pension costs
AB Volvo2294.8 90.2 83.9 230.7 68.1 34.0
Subsidiaries 39,151.6 9,590.0 4,041.9 36,807.8 8,583.5 3,437.0
Group total339,446.4 9,680.2 4,125.8 37,038.5 8,651.6 3,471.0
1 Including current and former Board members, Presidents and Executive
Vice Presidents.
2 The Parent Company’s pension costs, pertaining to Board members and Presidents
are disclosed in Note 3 in the Parent Company.
3 Of the Volvo Group’s pension costs, 92,4 (96.8) pertain to Board members and
Presidents, including current and former Board members, Presidents and Exec-
utive Vice Presidents. The Volvo Group’s outstanding pension obligations to
these individuals amount to 368.4 (337.7).
2012 2 011
Average number
of employees Number of
employees of which
women, % Number of
employees of which
women, %
AB Volvo
Sweden 236 44 171 49
Subsidiaries
Sweden 23,028 20 24,793 20
Western Europe
(excl. Sweden) 22,116 18 24,241 17
Eastern Europe 6,603 21 6,220 21
North America 16,481 18 15,380 18
South America 6,150 14 6,080 14
Asia 24,798 10 22,915 11
Other countries 2,670 17 2,448 17
Group total 102,082 17 102,248 18
2012 2 011
Board members1 and other
senior executives
Number
at year-
end
of which
women,
%
Number
at year-
end
of which
women,
%
AB Volvo
Board members112 17 14 14
CEO and other senior executives 16 19 17 6
Volvo Group
Board members1691 14 898 13
Presidents and other
senior executives 893 19 1,034 17
1 Excluding deputy Board members.
The cost for the cash-based version of the incentive program amounted
to 12 (4) including social security cost during 2012, and the total liability
amouned to 16 (4) as of Decmber 31, 2012.
A number of program participants that are leaving the company have been
determined to be “good leavers” and are therefore entitled to accumulated
allotment of shares. During 2012, including both the share settled plan and
and the cash-settled plan, a total of 250,922 shares (929) have been allotted
to participants, and an additional 246,917 shares (203,520) will be allotted to
participants when the employees leave the company. For the cash-settled
plan, a total of 1 (0) has been allotted during 2012.
The total cost for the 2012 incentive program over the period 2012 to
2015 is estimated to 148 including social security cost. Actual cost will be
impacted by changes in the share price.
The cost for non-monetary benefits in the Volvo Group amounted to
2,100.0 (1,876.8) of which 66.1 (68.8) to Board members and Presidents.
The cost for non-monetary benefits in the Parent Company amounted
to 12.8 (9.6) of which 1.7 (1.9) to Board members and Presidents.
NOTES TO FINANCIAL STATEMENTS
FINANCIAL INFORMATION 2012
138