Volvo 2012 Annual Report Download - page 17
Download and view the complete annual report
Please find page 17 of the 2012 Volvo annual report below. You can navigate through the pages in the report by either clicking on the pages listed below, or by using the keyword search tool below to find specific information within the annual report.-
 1
1 -
2
-
3
-
4
-
5
-
6
-
 7
7 -
 8
8 -
 9
9 -
 10
10 -
 11
11 -
 12
12 -
 13
13 -
 14
14 -
 15
15 -
 16
16 -
 17
17 -
 18
18 -
 19
19 -
 20
20 -
 21
21 -
 22
22 -
 23
23 -
 24
24 -
 25
25 -
 26
26 -
 27
27 -
28
-
29
-
30
-
31
-
32
-
33
-
34
-
35
-
36
-
37
-
38
-
39
-
40
-
41
-
42
-
43
-
44
-
45
-
46
-
47
-
48
-
49
-
50
-
51
-
52
-
53
-
54
-
55
-
56
-
57
-
58
-
59
-
60
-
61
-
62
-
63
-
64
-
65
-
66
-
67
-
68
-
69
-
70
-
71
-
72
-
73
-
74
-
75
-
76
-
77
-
78
-
79
-
80
-
81
-
82
-
83
-
84
-
85
-
86
-
87
-
88
-
89
-
90
-
91
-
92
-
93
-
94
-
95
-
96
-
97
-
98
-
99
-
100
-
101
-
102
-
103
-
104
-
105
-
106
-
107
-
108
-
109
-
110
-
111
-
112
-
113
-
114
-
115
-
116
-
117
-
118
-
119
-
120
-
121
-
122
-
123
-
124
-
125
-
126
-
127
-
128
-
129
-
130
-
131
-
132
-
133
-
134
-
135
-
136
-
137
-
138
-
139
-
140
-
141
-
142
-
143
-
144
-
145
-
146
-
147
-
148
-
149
-
150
-
151
-
152
-
153
-
154
-
155
-
156
-
157
-
158
-
159
-
160
-
161
-
162
-
163
-
164
-
165
-
166
-
167
-
168
-
169
-
170
-
171
-
172
-
173
-
174
-
175
-
176
-
177
-
178
-
179
-
180
-
181
-
182
-
183
-
184
-
185
-
186
-
187
-
188
-
189
-
190
 |
 |
Truck operations' focus areas
and strategic objectives
After 15 years of active acquisition strategy and streamlining to commercial vehicles, the Volvo Group is now entering a
new phase, with a focus on driving organic growth and improving profitability. In the strategy for 2013 – 2015, we have
identified five focus areas that have particularly high impact on the truck operation, for which there are 20
strategic objectives. Each objective is clearly restricted and measurable and is connected to both financial and operational
key figures. In addition, there is a clearly defined responsible party for each individual strategic objective.
1.1 Increase vehicle gross profit margin per region
by 3 percentage points
To increase the vehicle gross profit margin we
must sell our products at the optimal price level
and offer the right product mix in various markets.
It also requires that we understand our customers
– and their customers – and that we continuously
improve the sales process.
1.2 Reduce actual standard cost of sales on total
cost for current offer by 10%
Reducing the actual standard cost of sales will
improve the bottom line, lower the break-even
point and enable profitable growth. The main
components of standard cost of sales include the
material cost, manufacturing cost, logistics cost,
warranty and technical goodwill.
1.3 Decrease wholesale selling expenses
to 5% of sales
To reduce selling expenses we must align our whole-
sale organizations – from region to end customers –
to drive productivity and efficiency. Sharing best
practice and fine-tuning our processes will play an
important role.
1.4 Increase own dealer soft offer absorption rate by
10 percentage points
A healthy aftermarket business with a total offer
approach will reduce the vulnerability of our dealers
to the cyclical demand for new trucks. A first-rate
dealer network is also an important driver of cus-
tomer loyalty and a way for us to become a real
solutions provider. We need an appropriate number
of workshops in the right locations, with the right
tools, methods, and personnel skills, working
according to the Genuine Service Process.
1.5 Reduce R&D cost (spending pace)
to 11.5 BSEK
A flexible, scalable research and development
structure is key to increasing R&D efficiency.
This will help us to more effectively manage
multiple demands in various markets. An opti-
mized project portfolio is another key factor.
1.6 IT cost on 2% of Volvo Group total cost
by 2015
This strategic objective is to optimize the busi-
ness value from IT over time. The use of global
processes enables the deployment of a larger
proportion of common applications and the
phasing out of redundant applications. One goal
is to improve the balance between running and
development cost. It is crucial that we keep a
tight rein on IT costs even in an upturn when
margins are better.
Among the activities to
increase the gross margin
are the coordination of the brand and product
positioning (Read more on page 22), the launch of a new
truck series for the lower price segments in emerging markets
(Page 48) and the phase-out of unprofitable products and
markets (Read more about UD Trucks in North America on
page 42).
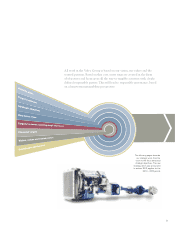
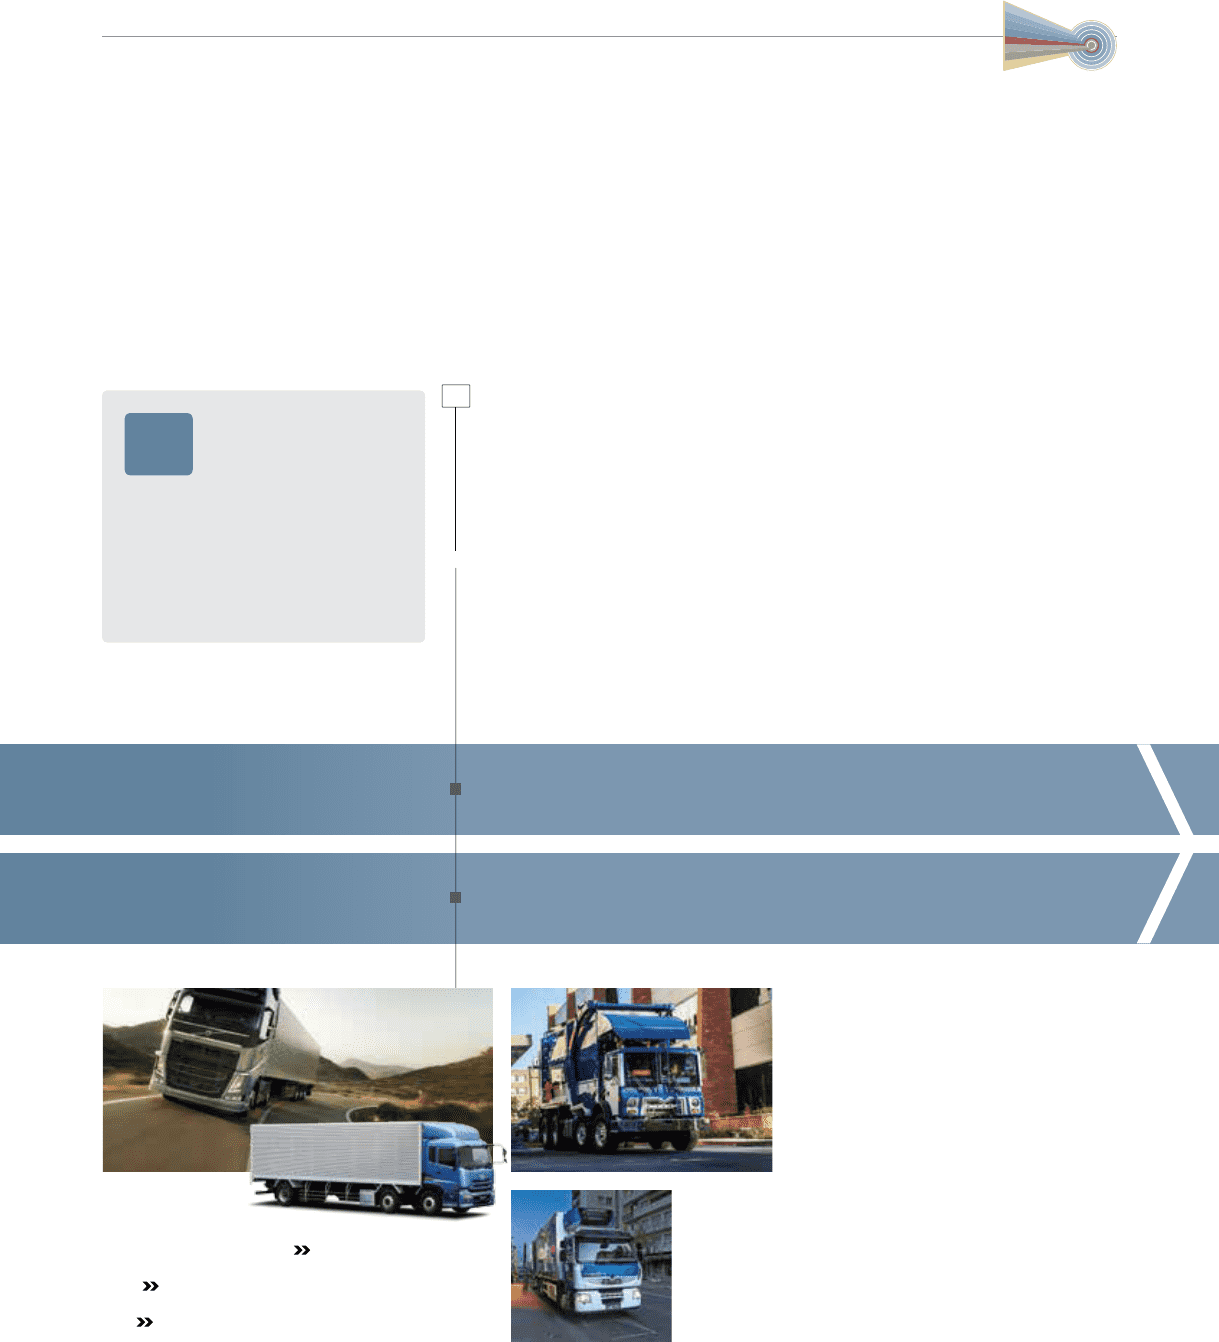
Focus area 1: Secure number
1 or 2 in profitability
We operate in a capital-intensive
industry. Significant investments
are necessary to simply comply with new regu-
lations. Furthermore, a strong financial position
affords us the opportunity to act, and to fund
innovation and development, and our own
expansion. To achieve this, we must excel in
turning “volumes into profit” and capture the
potential for efficiency that is associated with
being a truly global player.
1
13