Volvo 2012 Annual Report Download - page 153
Download and view the complete annual report
Please find page 153 of the 2012 Volvo annual report below. You can navigate through the pages in the report by either clicking on the pages listed below, or by using the keyword search tool below to find specific information within the annual report.-
 1
1 -
2
-
3
-
4
-
5
-
6
-
7
-
8
-
9
-
10
-
11
-
12
-
13
-
14
-
15
-
16
-
17
-
18
-
19
-
20
-
21
-
22
-
23
-
24
-
25
-
26
-
27
-
28
-
29
-
30
-
31
-
32
-
33
-
34
-
35
-
36
-
37
-
38
-
39
-
40
-
41
-
42
-
43
-
44
-
45
-
46
-
47
-
48
-
49
-
50
-
51
-
52
-
53
-
54
-
55
-
56
-
57
-
58
-
59
-
60
-
61
-
62
-
63
-
64
-
65
-
66
-
67
-
68
-
69
-
70
-
71
-
72
-
73
-
74
-
75
-
76
-
77
-
78
-
79
-
80
-
81
-
82
-
83
-
84
-
85
-
86
-
87
-
88
-
89
-
90
-
91
-
92
-
93
-
94
-
95
-
96
-
97
-
98
-
99
-
100
-
101
-
102
-
103
-
104
-
105
-
106
-
107
-
108
-
109
-
110
-
111
-
112
-
113
-
114
-
115
-
116
-
117
-
118
-
119
-
120
-
121
-
122
-
123
-
124
-
125
-
126
-
127
-
128
-
129
-
130
-
131
-
132
-
133
-
134
-
135
-
136
-
137
-
138
-
139
-
140
-
141
-
142
-
 143
143 -
 144
144 -
 145
145 -
 146
146 -
 147
147 -
 148
148 -
 149
149 -
 150
150 -
 151
151 -
 152
152 -
 153
153 -
 154
154 -
 155
155 -
 156
156 -
 157
157 -
 158
158 -
 159
159 -
 160
160 -
 161
161 -
 162
162 -
 163
163 -
164
-
165
-
166
-
167
-
168
-
169
-
170
-
171
-
172
-
173
-
174
-
175
-
176
-
177
-
178
-
179
-
180
-
181
-
182
-
183
-
184
-
185
-
186
-
187
-
188
-
189
-
190
 |
 |

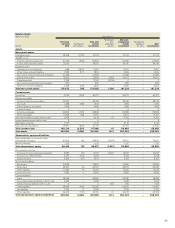
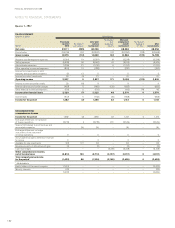
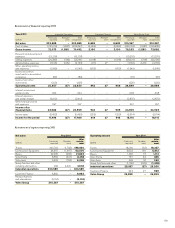
Balance sheets
March 31, 2012 Volvo Group
SEK M
Previously
reported
2012
Restatement
Joint ventures
After Joint
venture
restatement
Restatement
post-
employment
benefits
After post-
employment
benefit
restatement
Restatement
hedging of
firm flows
After
restatements
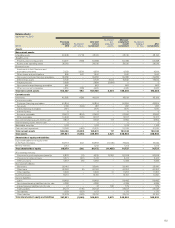
Assets
Non-current assets
Intangible assets 38,768 (1,755) 37,013 –37,013 –37,013
Tangible assets
Property, plant and equipment 53,160 (655) 52,505 –52,505 –52,505
Assets under operating leases 24 ,175 –24,175 –24,175 –24,175
Financial assets
Investments in Joint Ventures 688 2,603 3,291 –3,291 –3,291
Other shares and participations 1,266 577 1,843 –1,843 –1,843
Non-current customer-financing receivables 41,482 –41,482 –41,482 –41,482
Deferred tax assets 12,509 –12,509 3,492 16,001 –16,001
Prepaid pensions 2,196 –2,196 (2,196) 0 – 0
Non-current interest-bearing receivables 620 –620 –620 –620
Other non-current receivables 4,469 (175) 4,294 – 4,294 –4,294
Total non-current assets 179,333 595 179,928 1,296 181,224 –181,224
Current assets
Inventories 47,129 (392) 46,737 –46,737 –46,737
Current receivables
Customer-financing receivables 38 ,474 –38 ,474 –38,474 –38,474
Tax assets 1,488 (182) 1,306 –1,306 –1,306
Interest-bearing receivables 1,469 –1,469 –1,469 –1,469
Internal funding 0 – 0 – 0 – 0
Accounts receivable 30,623 (755) 29,868 –29,868 –29,868
Other receivables 14,793 (92) 14,701 –14,701 –14,701
Non interest-bearing assets held for sale 9,124 –9,124 117 9,241 –9, 241
Interest-bearing assets held for sale 8 – 8 – 8 – 8
Marketable securities 9,140 –9,140 –9,140 –9,140
Cash and cash equivalents 27, 971 (830) 27,141 –27,141 –27,141
Total current assets 180,219 (2,251) 177,968 117 178,085 –178,085
Total assets 359,552 (1,656) 357,896 1,413 359,309 –359,309
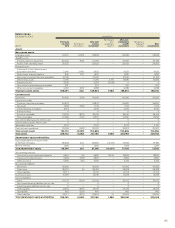
Shareholders’ equity and liabilities
Equity attributable to the equity holder
of the Parent Company 87,295 143 87,438 (7,607) 79,831 –79,831
Minority interests 1,135 –1,135 –1,135 –1,135
Total shareholders’ equity 88,430 143 88,573 ( 7,607) 80,966 –80,966
Non-current provisions
Provisions for post-employment benefits 6,580 (10) 6,570 8,457 15,027 –15,027
Provisions for deferred taxes 5,491 (173) 5,318 –5,318 –5,318
Other provisions 5,592 (81) 5 , 511 –5 , 511 –5 , 511
Non-current liabilities
Bond loans 37,695 –37,695 –37,695 –37,695
Other loans 49,577 (4) 49,573 –49,573 –49,573
Other liabilities 10,734 (1) 10,733 –10,733 –10,733
Current provisions 9,783 09,783 –9,783 –9,783
Current liabilities
Loans 48,286 –48,286 –48,286 –48,286
Non interest-bearing liabilities held for sale 4,246 –4,246 –4,246 –4,246
Interest-bearing liabilities held for sale 3 – 3 532 535 –535
Trade payables 56,496 (815) 55,681 –55,681 –55,681
Tax liabilities 2,184 02,184 –2,184 –2,184
Other liabilities 34,455 (714) 3 3,741 31 33,772 –33,772
Total shareholders’ equity and liabilities 359,552 (1,656) 357,896 1,413 359,309 –359,309
149