Volvo 2012 Annual Report Download - page 94
Download and view the complete annual report
Please find page 94 of the 2012 Volvo annual report below. You can navigate through the pages in the report by either clicking on the pages listed below, or by using the keyword search tool below to find specific information within the annual report.-
 1
1 -
2
-
3
-
4
-
5
-
6
-
7
-
8
-
9
-
10
-
11
-
12
-
13
-
14
-
15
-
16
-
17
-
18
-
19
-
20
-
21
-
22
-
23
-
24
-
25
-
26
-
27
-
28
-
29
-
30
-
31
-
32
-
33
-
34
-
35
-
36
-
37
-
38
-
39
-
40
-
41
-
42
-
43
-
44
-
45
-
46
-
47
-
48
-
49
-
50
-
51
-
52
-
53
-
54
-
55
-
56
-
57
-
58
-
59
-
60
-
61
-
62
-
63
-
64
-
65
-
66
-
67
-
68
-
69
-
70
-
71
-
72
-
73
-
74
-
75
-
76
-
77
-
78
-
79
-
80
-
81
-
82
-
83
-
 84
84 -
 85
85 -
 86
86 -
 87
87 -
 88
88 -
 89
89 -
 90
90 -
 91
91 -
 92
92 -
 93
93 -
 94
94 -
 95
95 -
 96
96 -
 97
97 -
 98
98 -
 99
99 -
 100
100 -
 101
101 -
 102
102 -
 103
103 -
 104
104 -
105
-
106
-
107
-
108
-
109
-
110
-
111
-
112
-
113
-
114
-
115
-
116
-
117
-
118
-
119
-
120
-
121
-
122
-
123
-
124
-
125
-
126
-
127
-
128
-
129
-
130
-
131
-
132
-
133
-
134
-
135
-
136
-
137
-
138
-
139
-
140
-
141
-
142
-
143
-
144
-
145
-
146
-
147
-
148
-
149
-
150
-
151
-
152
-
153
-
154
-
155
-
156
-
157
-
158
-
159
-
160
-
161
-
162
-
163
-
164
-
165
-
166
-
167
-
168
-
169
-
170
-
171
-
172
-
173
-
174
-
175
-
176
-
177
-
178
-
179
-
180
-
181
-
182
-
183
-
184
-
185
-
186
-
187
-
188
-
189
-
190
 |
 |

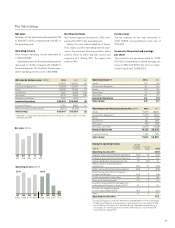
For the Volvo Group, 2012 was characterized by a strong first half of the year and a weaker second half,
which resulted in lower sales and declining operating income compared to 2011. However, net sales for
the year were above SEK 300 billion and operating income amounted to SEK 17.6 billion.
FINANCIAL PERFORMANCE
Lower earnings
INCOME STATEMENTS VOLVO GROUP
Industrial operations Customer Finance Eliminations Volvo Group
SEK M 2012 2011 2012 2 011 2012 2 011 2012 2 011
Net sales Note 6,7 296,031 303,589 9,783 8,883 (2,167) (2,104) 303,647 310,367
Cost of sales (231,216) (233,097) (6,036) (5,693) 2,167 2,104 (235,085) (236,685)
Gross income 64,815 70,492 3.747 3,190 0 0 68,562 73,682
Research and development expenses Note 6 (14,794) (13,276) 0 0 0 0 (14,794) (13,276)
Selling expenses (26,582) (25,181) (1,666) (1,618) 0 0 (28,248) (26,799)
Administrative expenses (5,639) (4,753) (30) 0 0 0 (5,669) (4,753)
Other operating income and expenses Note 8 (1,600) (1,045) (559) (603) 0 0 (2,160) (1,649)
Income from investments in associated
companies Note 5,6 (23) (82) 0 0 0 0 (23) (81)
Income from other investments Note 5 (46) (225) 0 0 0 0 (47) (225)
Operating income 16,130 25,930 1,492 969 0 0 17,622 26,899
Interest income and similar credits 510 644 0 0 0 (37) 510 608
Interest expenses and similar charges (2,476) (2,912) 0 0 0 37 (2,476) (2,875)
Other financial income and expenses Note 9 (301) 297 0 0 0 0 (301) 297
Income after financial items 13,863 23,959 1,492 969 0 0 15,355 24,929
Income taxes Note 10 (3,663) (6,490) (434) (323) 0 0 (4,097) (6,814)
Income for the period* 10,200 17, 49 6 1,058 646 0 0 11, 258 18,115
* Attributable to:
Equity holders of the parent company 11, 0 3 9 17,751
Minority interests Not e 11 219 364
11, 258 18,115
Basic earnings per share, SEK Note 19 5.44 8.76
Diluted earnings per share, SEK Note 19 5.44 8.75
OTHER COMPREHENSIVE INCOME
SEK M 2012 2011
Income for the period 11,258 18,115
Translation differences on foreign operations (3,916) (980)
Translation differences on hedge instruments of net investment in foreign operations 0(3)
Accumulated translation difference reversed to income (118) (30)
Available-for-sale investments (4) 39
Change in cash flow hedge reserve Note 19 8 (144)
Other comprehensive income, net of income taxes (4,030) (1,118)
Total comprehensive income for the period 7,228 16,997
Attributable to:
Equity holders of the Parent Company 7,092 16,681
Minority interests 136 316
7,228 16,997
90
FINANCIAL INFORMATION 2012