Volvo 2012 Annual Report Download - page 124
Download and view the complete annual report
Please find page 124 of the 2012 Volvo annual report below. You can navigate through the pages in the report by either clicking on the pages listed below, or by using the keyword search tool below to find specific information within the annual report.-
 1
1 -
2
-
3
-
4
-
5
-
6
-
7
-
8
-
9
-
10
-
11
-
12
-
13
-
14
-
15
-
16
-
17
-
18
-
19
-
20
-
21
-
22
-
23
-
24
-
25
-
26
-
27
-
28
-
29
-
30
-
31
-
32
-
33
-
34
-
35
-
36
-
37
-
38
-
39
-
40
-
41
-
42
-
43
-
44
-
45
-
46
-
47
-
48
-
49
-
50
-
51
-
52
-
53
-
54
-
55
-
56
-
57
-
58
-
59
-
60
-
61
-
62
-
63
-
64
-
65
-
66
-
67
-
68
-
69
-
70
-
71
-
72
-
73
-
74
-
75
-
76
-
77
-
78
-
79
-
80
-
81
-
82
-
83
-
84
-
85
-
86
-
87
-
88
-
89
-
90
-
91
-
92
-
93
-
94
-
95
-
96
-
97
-
98
-
99
-
100
-
101
-
102
-
103
-
104
-
105
-
106
-
107
-
108
-
109
-
110
-
111
-
112
-
113
-
 114
114 -
 115
115 -
 116
116 -
 117
117 -
 118
118 -
 119
119 -
 120
120 -
 121
121 -
 122
122 -
 123
123 -
 124
124 -
 125
125 -
 126
126 -
 127
127 -
 128
128 -
 129
129 -
 130
130 -
 131
131 -
 132
132 -
 133
133 -
 134
134 -
135
-
136
-
137
-
138
-
139
-
140
-
141
-
142
-
143
-
144
-
145
-
146
-
147
-
148
-
149
-
150
-
151
-
152
-
153
-
154
-
155
-
156
-
157
-
158
-
159
-
160
-
161
-
162
-
163
-
164
-
165
-
166
-
167
-
168
-
169
-
170
-
171
-
172
-
173
-
174
-
175
-
176
-
177
-
178
-
179
-
180
-
181
-
182
-
183
-
184
-
185
-
186
-
187
-
188
-
189
-
190
 |
 |
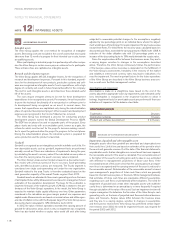
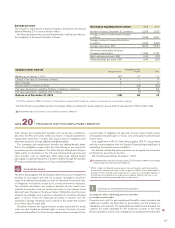
Tangible assets
The Volvo Group applies the cost method for measurement of tangible
assets. Borrowing costs are included in the acquisition value of assets
that necessarily take more than 12 months to get ready for their intended
use or sale, so called qualifying assets.
Investment properties are properties owned for the purpose of obtaining
rental income and/or appreciation in value. Investment properties are recog-
nized at cost. Information regarding the estimated fair value of investment
properties is based on discounted cash flow projections The required return
is based on current property market conditions for comparable properties in
comparable locations.
Depreciation and impairment
Property, plant and equipment are depreciated over their useful lives.
Useful lives are based on estimates of the period over which the assets
will generate revenue.
Depreciation is recognized on a straight-line basis based on the cost of
the assets, adjusted in appropriate cases by impairments, and estimated
useful lives. Depreciation is recognized in the respective function to which it
belongs. Impairment tests for depreciable non-current assets are performed
if there are indications of impairment at the balance-sheet date.
Depreciation periods
Type-specific tools 2 to 8 years
Assets under operating leases 3 to 5 years
Machinery 5 to 20 years
Buildings and investment properties 25 to 50 years
Land improvements 20 years
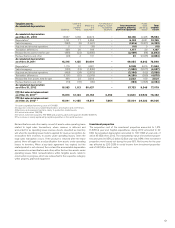
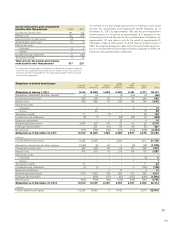
Tangible assets,
Acquisition cost
Buildings
Land and
land
improve-
ments
Machinery
and equip-
ment3
Construction in
progress, including
advance payments
Total investment
property, property,
plant and equipment
Assets
under
operating
leases
Total
tangible
assets
Acquisition costs as of Dec 31, 2010 31,558 12,567 70,514 5,709 120,348 29,095 149,443
Capital expenditures1548 266 3,947 3,455 8,216 7,414 15,630
Sales/scrapping (299) (88) (1,969) 0(2,356) (4,786) (7,142)
Acquired and divested operations 36 10 64 0110 1,503 1,613
Translation differences 373 411 889 (33) 1,640 122 1,762
Reclassified to assets held for sale (706) (49) (4,586) (57) (5,398) (131) (5,529)
Reclassifications and other 619 141 1,897 (2,622) 35 (652) (617)
Acquisition costs as of Dec 31, 2011 32,129 13,258 70,756 6,452 122,595 32,565 155,160
Capital expenditures1848 348 3,296 5,031 9,523 9,986 19,509
Sales/scrapping (234) (32) (2,121) (13) (2,400) (5,229) (7, 629)
Acquired and divested operations (661) (9) (4,244) (92) (5,006) 69 (4,937)
Translation differences (1,775) (1,276) (3,875) (179) (7,105) (1,438) (8,543)
Reclassifiedfrom assets held for sale 706 49 4,584 57 5,396 219 5,615
Reclassifications and other 1, 211 260 1,855 (3,592) (266) 2,196 1,930
Acquisition costs as of Dec 31, 2012 32,224 12,598 70,251 7,6 64 122,737 38,368 161,105
ACCOUNTING POLICIES
SOURCES OF ESTIMATION UNCERTAINTY
!
Impairment of tangible assets
If, at the balance-sheet date, there is any indication that a tangible asset
has been impaired, the recoverable amount of the asset should be esti-
mated. The recoverable amount is the higher of the asset’s net selling
price and its value in use, estimated with reference to management’s pro-
jections of future cash flows. If the recoverable amount of the asset is less
than the carrying amount, an impairment loss is recognized and the carry-
ing amount of the asset is reduced to the recoverable amount. Determina-
tion of the recoverable amount is based upon management’s projections
of future cash flows, which are generally made by use of internal business
plans or forecasts. While management believes that estimates of future
cash flows are reasonable, different assumptions regarding such cash
flows could materially affect valuations.
NOTE 13
TANGIBLE ASSETS
NOTES TO FINANCIAL STATEMENTS
FINANCIAL INFORMATION 2012
120