Volvo 2012 Annual Report Download - page 113
Download and view the complete annual report
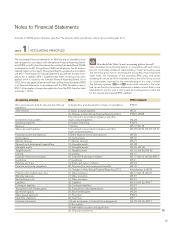
Please find page 113 of the 2012 Volvo annual report below. You can navigate through the pages in the report by either clicking on the pages listed below, or by using the keyword search tool below to find specific information within the annual report.-
 1
1 -
2
-
3
-
4
-
5
-
6
-
7
-
8
-
9
-
10
-
11
-
12
-
13
-
14
-
15
-
16
-
17
-
18
-
19
-
20
-
21
-
22
-
23
-
24
-
25
-
26
-
27
-
28
-
29
-
30
-
31
-
32
-
33
-
34
-
35
-
36
-
37
-
38
-
39
-
40
-
41
-
42
-
43
-
44
-
45
-
46
-
47
-
48
-
49
-
50
-
51
-
52
-
53
-
54
-
55
-
56
-
57
-
58
-
59
-
60
-
61
-
62
-
63
-
64
-
65
-
66
-
67
-
68
-
69
-
70
-
71
-
72
-
73
-
74
-
75
-
76
-
77
-
78
-
79
-
80
-
81
-
82
-
83
-
84
-
85
-
86
-
87
-
88
-
89
-
90
-
91
-
92
-
93
-
94
-
95
-
96
-
97
-
98
-
99
-
100
-
101
-
102
-
 103
103 -
 104
104 -
 105
105 -
 106
106 -
 107
107 -
 108
108 -
 109
109 -
 110
110 -
 111
111 -
 112
112 -
 113
113 -
 114
114 -
 115
115 -
 116
116 -
 117
117 -
 118
118 -
 119
119 -
 120
120 -
 121
121 -
 122
122 -
 123
123 -
124
-
125
-
126
-
127
-
128
-
129
-
130
-
131
-
132
-
133
-
134
-
135
-
136
-
137
-
138
-
139
-
140
-
141
-
142
-
143
-
144
-
145
-
146
-
147
-
148
-
149
-
150
-
151
-
152
-
153
-
154
-
155
-
156
-
157
-
158
-
159
-
160
-
161
-
162
-
163
-
164
-
165
-
166
-
167
-
168
-
169
-
170
-
171
-
172
-
173
-
174
-
175
-
176
-
177
-
178
-
179
-
180
-
181
-
182
-
183
-
184
-
185
-
186
-
187
-
188
-
189
-
190
 |
 |

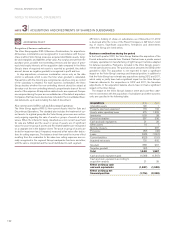
Joint ventures
Joint ventures are companies over which the Volvo Group has controlling
influence together with one or more external parties. Joint ventures are up to
and including December 31, 2012, recognized by applying the proportionate
consolidation method, in accordance with IAS 31 Interests in Joint ventures.
Read more about changes in the Volvo Group’s accouting for Joint Ventures
as from January 1, 2013 in Note 31.
Associated companies
Associated companies are companies in which the Volvo Group has a
significant influence, normally when the Group’s holdings equal at least
20% but less than 50% of the voting rights. Holdings in associated com-
panies are recognized in accordance with the equity method. The Volvo
Group’s share of recognized income in such companies is included in the
consolidated statement of profit or loss under Income from investments in
associated companies, less, where appropriate, depreciation of surplus
values and the effect of applying different accounting policies. Income
from associated companies is included in operating income since the
Volvo Group’s investments are of operating nature. For practical reasons,
some of the associated companies are included in the consolidated finan-
cial statements with a certain time lag, normally one quarter. Dividends
from associated companies are not included in consolidated income. In
the consolidated balance sheet, investments in associated companies are
affected by the Volvo Group’s share of the company’s net income, less
depreciation of surplus values and dividends received.
Other shares and participations
Holding of shares that do not provide the Volvo Group with significant influ-
ence, which generally means that Volvo Group’s holding of shares corre-
sponds to less than 20% of the votes, are recognized as other shares and
participations. For listed shares, the carrying amount is equivalent to the
market value. Unlisted shares and participations, for which a fair value can-
not reasonably be determined, are measured at cost less any impairment.
Joint ventures
The Volvo Group’s investments in joint ventures are listed below.
Shares in joint ventures Dec 31, 2012 Dec 31, 2011
Holding percentage Holding percentage
Shanghai Sunwin Bus Corp.,
China 50 50
Dong Feng Nissan Diesel
Motor Co., Ltd., China 50 50
VE Commercial Vehicles,
Ltd., India 501 501
1 Direct equity holdingamounts to45,6%and indirect equity holdingamounts
to4,6%.
ACCOUNTING POLICIES
NOTE 5
INVESTMENTS IN ASSOCIATED COMPANIES AND OTHER SHARES AND PARTICIPATIONS
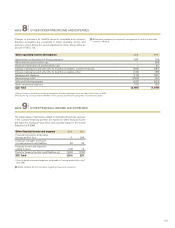
Volvo Group’s share of joint ventures’
income statements VE Commercial
Vehicles, Ltd. Other joint
ventures Total
2012 VE Commercial
Vehicles, Ltd. Other joint
ventures Total
2011
Net sales 3,302 902 4,204 3,453 743 4,196
Operating income 148 (4) 144 246 77 323
Income after financial items 202 (22) 180 310 69 379
Income taxes (47) 2(45) (72) (1) (73)
Volvo Group’s share of joint
ventures' income for the period 155 (20) 135 238 68 306
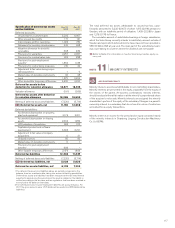
Volvo Group’s share of joint ventures’
balance sheets VE Commercial
Vehicles, Ltd. Other joint
ventures Total as of
Dec 31, 2012 VE Commercial
Vehicles, Ltd. Other joint
ventures Total as of
Dec 31, 2011
Non-current assets 1,925 256 2,181 1,746 169 1,915
Current assets 1,329 766 2,095 1,521 727 2,248
The Volvo Group's share of joint
ventures' assets 3,254 1,022 4,276 3,267 896 4,163
Shareholders’ equity 2,140 240 2,380 2,231 274 2,505
Provisions 232 3235 271 3274
Long-term liabilities 3 2 5 3 3 6
Current liabilities 879 777 1,656 762 616 1,378
The Volvo Group's share of joint
ventures' equity and liabilities 3,254 1,022 4,276 3,267 896 4,163
Net financial position for the joint ventures (excluding post-employment benefits) amounted to 244 as of December 31, 2012.
As of December 31, Volvo Group’s share of contingent liabilities in its joint ventures totaled 61 (38).
109