Volvo 2012 Annual Report Download - page 71
Download and view the complete annual report
Please find page 71 of the 2012 Volvo annual report below. You can navigate through the pages in the report by either clicking on the pages listed below, or by using the keyword search tool below to find specific information within the annual report.-
 1
1 -
2
-
3
-
4
-
5
-
6
-
7
-
8
-
9
-
10
-
11
-
12
-
13
-
14
-
15
-
16
-
17
-
18
-
19
-
20
-
21
-
22
-
23
-
24
-
25
-
26
-
27
-
28
-
29
-
30
-
31
-
32
-
33
-
34
-
35
-
36
-
37
-
38
-
39
-
40
-
41
-
42
-
43
-
44
-
45
-
46
-
47
-
48
-
49
-
50
-
51
-
52
-
53
-
54
-
55
-
56
-
57
-
58
-
59
-
60
-
 61
61 -
 62
62 -
 63
63 -
 64
64 -
 65
65 -
 66
66 -
 67
67 -
 68
68 -
 69
69 -
 70
70 -
 71
71 -
 72
72 -
 73
73 -
 74
74 -
 75
75 -
 76
76 -
 77
77 -
 78
78 -
 79
79 -
 80
80 -
 81
81 -
82
-
83
-
84
-
85
-
86
-
87
-
88
-
89
-
90
-
91
-
92
-
93
-
94
-
95
-
96
-
97
-
98
-
99
-
100
-
101
-
102
-
103
-
104
-
105
-
106
-
107
-
108
-
109
-
110
-
111
-
112
-
113
-
114
-
115
-
116
-
117
-
118
-
119
-
120
-
121
-
122
-
123
-
124
-
125
-
126
-
127
-
128
-
129
-
130
-
131
-
132
-
133
-
134
-
135
-
136
-
137
-
138
-
139
-
140
-
141
-
142
-
143
-
144
-
145
-
146
-
147
-
148
-
149
-
150
-
151
-
152
-
153
-
154
-
155
-
156
-
157
-
158
-
159
-
160
-
161
-
162
-
163
-
164
-
165
-
166
-
167
-
168
-
169
-
170
-
171
-
172
-
173
-
174
-
175
-
176
-
177
-
178
-
179
-
180
-
181
-
182
-
183
-
184
-
185
-
186
-
187
-
188
-
189
-
190
 |
 |
3027
Volvo
Trucks
Renault
Trucks
Mack
Trucks
Buses Volvo
CE
UD
Trucks
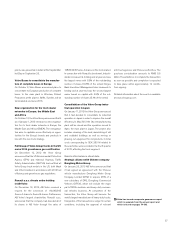
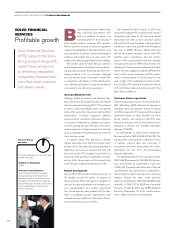
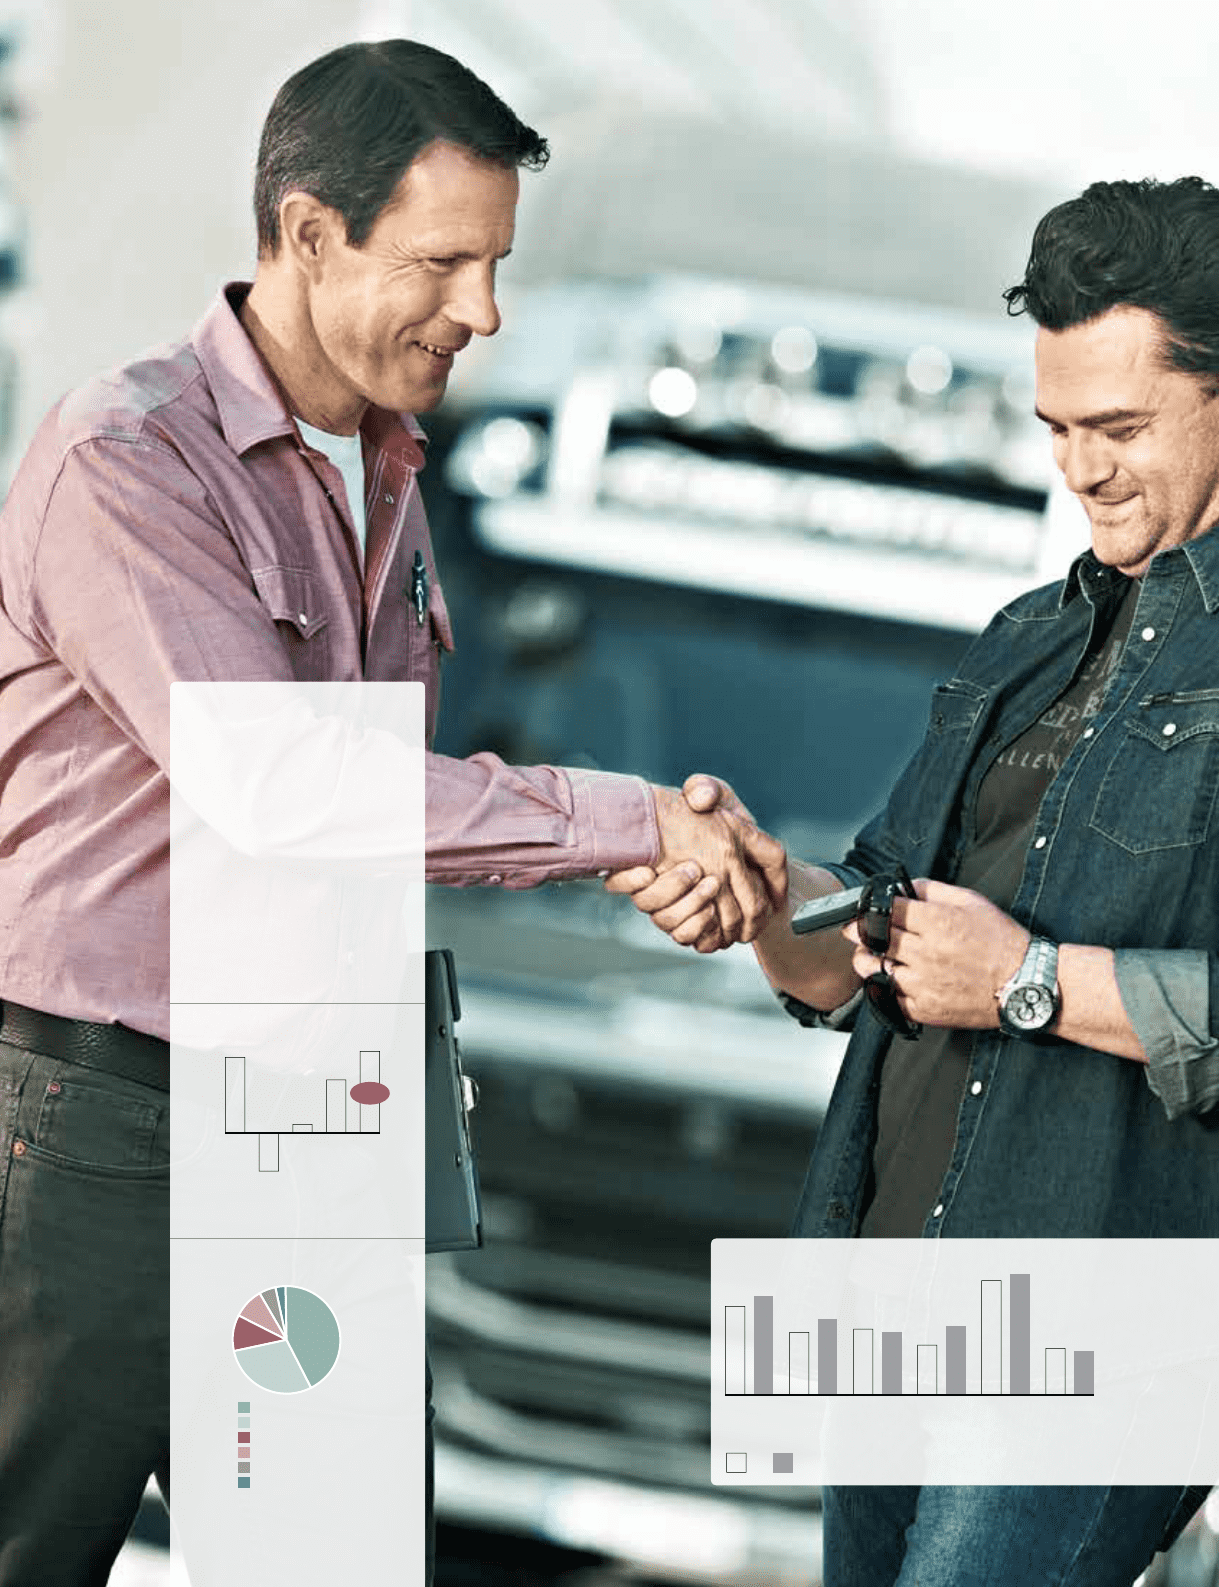
2319 1920 2115 3735 1314
11 12
1 Share of unit
sales financed
by Volvo
Financial Ser-
vices in rela-
tion to total
number units
sold by the
Volvo Group in
markets
where finan-
cial services
are offered.
Penetration rate1, %
Operating income (loss)
SEK M
12
1,492
11
969
10
167
09
(680)
08
1,397
1,492
Volvo Trucks 43%
Volvo CE 29%
Renault Trucks 11%
Mack Trucks 9%
Buses 5%
UD Trucks 3%
Distribution of credit portfolio
Adds
value
Strengthens the relationship
with customers
VFS supplies financial services and
accompanying service to Volvo Group
customers. Together with the other
business areas, integrated solutions
are offered which add value to both
customers and the dealer network.
67