Volvo 2012 Annual Report Download - page 117
Download and view the complete annual report
Please find page 117 of the 2012 Volvo annual report below. You can navigate through the pages in the report by either clicking on the pages listed below, or by using the keyword search tool below to find specific information within the annual report.-
 1
1 -
2
-
3
-
4
-
5
-
6
-
7
-
8
-
9
-
10
-
11
-
12
-
13
-
14
-
15
-
16
-
17
-
18
-
19
-
20
-
21
-
22
-
23
-
24
-
25
-
26
-
27
-
28
-
29
-
30
-
31
-
32
-
33
-
34
-
35
-
36
-
37
-
38
-
39
-
40
-
41
-
42
-
43
-
44
-
45
-
46
-
47
-
48
-
49
-
50
-
51
-
52
-
53
-
54
-
55
-
56
-
57
-
58
-
59
-
60
-
61
-
62
-
63
-
64
-
65
-
66
-
67
-
68
-
69
-
70
-
71
-
72
-
73
-
74
-
75
-
76
-
77
-
78
-
79
-
80
-
81
-
82
-
83
-
84
-
85
-
86
-
87
-
88
-
89
-
90
-
91
-
92
-
93
-
94
-
95
-
96
-
97
-
98
-
99
-
100
-
101
-
102
-
103
-
104
-
105
-
106
-
 107
107 -
 108
108 -
 109
109 -
 110
110 -
 111
111 -
 112
112 -
 113
113 -
 114
114 -
 115
115 -
 116
116 -
 117
117 -
 118
118 -
 119
119 -
 120
120 -
 121
121 -
 122
122 -
 123
123 -
 124
124 -
 125
125 -
 126
126 -
 127
127 -
128
-
129
-
130
-
131
-
132
-
133
-
134
-
135
-
136
-
137
-
138
-
139
-
140
-
141
-
142
-
143
-
144
-
145
-
146
-
147
-
148
-
149
-
150
-
151
-
152
-
153
-
154
-
155
-
156
-
157
-
158
-
159
-
160
-
161
-
162
-
163
-
164
-
165
-
166
-
167
-
168
-
169
-
170
-
171
-
172
-
173
-
174
-
175
-
176
-
177
-
178
-
179
-
180
-
181
-
182
-
183
-
184
-
185
-
186
-
187
-
188
-
189
-
190
 |
 |

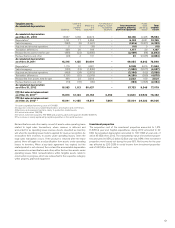
2011 Trucks
Con-
struction
Equipment Buses Volvo
Penta Volvo Aero
Group
functions
and other
incl. elimi-
nations Industrial
Operations Customer
Finance Elimina-
tions Volvo
Group
Net sales, external
customers 196,999 62,894 21,297 8,318 6,356 5,958 301,822 8,545 –310,367
Net sales, internal 1,921 606 526 140 0(1,426) 1,767 337 (2,104) 0
I/S Net sales 198,920 63,500 21,823 8,458 6,356 4,532 303,589 8,882 (2,104) 310,367
Expenses(180,703) (56,688) (20,722) (7,633) (5,996) (5,835) (277,577) (7,913) 2,104 (283,386)
I/S Income from
investments in associ-
ated companies 10 –13 – 0 (105) (82) 0 0 (82)
Operating income 18,227 6,812 1,114 825 360 (1,408) 25,930 969 026,899
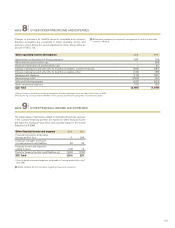
I/S Interest income
and similar credits 644 –(37) 608
I/S Interest expense
and simliar charges (2,912) –37 (2,875)
I/S Other financial
income and expense 297 – – 297
I/S Income after
financial items 23,959 969 024,929
Other segment infor-
mation
Depreciation and
amortization (8,531) (1,903) (472) (474) (504) 464 (11,419) (2,572) (13,992)
Restructuring costs (22) (10) (5) (2) 0(49) (88) (6) 0(94)
Gains/losses from
divestments – – – – – (19) (19) – – (19)
Capital expenditure 9,138 2,231 367 332 797 1,293 14,159 6 ,112 (52) 20,220
B/S Investments in
associated companies
(the equity method) 228 –23 – 1 432 – 0 – 684
B/S Assets held for sale
(total assets) 9,348 9,348 9,348
B/S Assets held for sale
(total liabilities) –––––(4,716) (4,716) – – (4,716)
Internal sales between segments are generally made at standard cost of sales, including calculated interest and product improvement expenses.
Internal sales from service companies are generally made at market price.
Reporting by market Net sales Non-current assets 1
2012 2 011 2012 2011
Europe 111, 6 0 6 120,828 71,350 65,522
of which Sweden 12,133 14,108 28,245 26, 315
of which France 24,273 27,061 17,207 15,214
North America 71,101 60,560 23,908 19,999
of which USA 56,441 46,984 19,923 16,288
South America 29,164 35,142 1,872 1,447
of which Brazil 18,662 26,056 1,515 1,166
Asia 69,278 73,586 26,271 30,018
of which China 19,990 22,952 2,265 2,194
of which Japan 18,987 17,865 17, 992 22,472
Other markets 22,498 20,251 998 982
I/S B/S Total 303,647 310,367 124,399 117,968
1 Non-current assets include intangible and tangible assets.
The reporting of net sales by market is based on where the customers are located.
113