Volvo 2012 Annual Report Download - page 10
Download and view the complete annual report
Please find page 10 of the 2012 Volvo annual report below. You can navigate through the pages in the report by either clicking on the pages listed below, or by using the keyword search tool below to find specific information within the annual report.-
 1
1 -
 2
2 -
 3
3 -
 4
4 -
 5
5 -
 6
6 -
 7
7 -
 8
8 -
 9
9 -
 10
10 -
 11
11 -
 12
12 -
 13
13 -
 14
14 -
 15
15 -
 16
16 -
 17
17 -
 18
18 -
 19
19 -
 20
20 -
 21
21 -
22
-
23
-
24
-
25
-
26
-
27
-
28
-
29
-
30
-
31
-
32
-
33
-
34
-
35
-
36
-
37
-
38
-
39
-
40
-
41
-
42
-
43
-
44
-
45
-
46
-
47
-
48
-
49
-
50
-
51
-
52
-
53
-
54
-
55
-
56
-
57
-
58
-
59
-
60
-
61
-
62
-
63
-
64
-
65
-
66
-
67
-
68
-
69
-
70
-
71
-
72
-
73
-
74
-
75
-
76
-
77
-
78
-
79
-
80
-
81
-
82
-
83
-
84
-
85
-
86
-
87
-
88
-
89
-
90
-
91
-
92
-
93
-
94
-
95
-
96
-
97
-
98
-
99
-
100
-
101
-
102
-
103
-
104
-
105
-
106
-
107
-
108
-
109
-
110
-
111
-
112
-
113
-
114
-
115
-
116
-
117
-
118
-
119
-
120
-
121
-
122
-
123
-
124
-
125
-
126
-
127
-
128
-
129
-
130
-
131
-
132
-
133
-
134
-
135
-
136
-
137
-
138
-
139
-
140
-
141
-
142
-
143
-
144
-
145
-
146
-
147
-
148
-
149
-
150
-
151
-
152
-
153
-
154
-
155
-
156
-
157
-
158
-
159
-
160
-
161
-
162
-
163
-
164
-
165
-
166
-
167
-
168
-
169
-
170
-
171
-
172
-
173
-
174
-
175
-
176
-
177
-
178
-
179
-
180
-
181
-
182
-
183
-
184
-
185
-
186
-
187
-
188
-
189
-
190
 |
 |

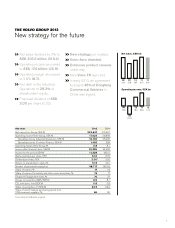
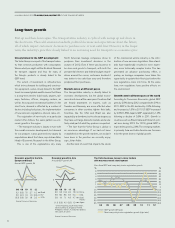
Closely linked to the GDP development
The Volvo Group is one part of the transport indus-
try that connects production with consumption.
We are what you might call the life blood. Demand
for transport capacity and thus for many of
the Group’s products is closely linked to the
GDP trend.
The extent of investment in infrastructure,
which drives demand for building and construc-
tion equipment, is also closely linked to the GDP
trend. Increased global wealth means that there
is a long-term need to build roads, airports, rail-
ways, factories, offices, shopping centers, as
well as housing and recreational facilities. In the
short term, demand is affected by a number of
factors including fuel prices, the implementation
of new emission regulations, interest rates, etc.
The registration of new trucks on a particular
market often follows the same pattern as eco-
nomic growth in the region.
– The transport industry is largely in tune with
the overall economic development, but demand
for our products is also governed very largely by
expectations about the future, says Johan Adler,
Head of Economic Research in the Volvo Group.
This is one of the explanations why many
North American haulage companies chose to
postpone their investment decisions in the
autumn of 2012. Even if there was business to
be done and goods to transport, with both the
presidential election and federal budget negoti-
ations around the corner, customers decided it
was better to be safe than sorry and therefore
postponed their purchases.
Markets move at different paces
The transportation industry is directly linked to
economic developments, but the global econo-
mies do not move at the same pace. Countries that
are heavily dependent on exports, such as
Sweden and Germany, are more affected when
consumers in other countries tighten their belts.
Countries like the USA and Brazil are also
impacted by a slowdown, but to a lesser degree, as
they have such large domestic markets and a rela-
tively small part of what they produce is exported.
− The fact that the Volvo Group is global is
an enormous advantage. If we had not been
established on the growth markets, we wouldn’t
have been in the position we currently enjoy,
says Johan Adler.
Another kind of event that impacts the whole
Economic growth in the U.S.,
Europe and Brazil
Annual GDP-growth, %
Source: Consensus Economics
EU
Brazil
11
1.6
2.7
1.8
12
(0.3)
1.0
2.2 USA
10
1.9
7.5
3.0
09
(4.1)
(0.3)
(3.5)
08
0.6
5.2
(0.3)
0
Economic growth in Asia
Annual GDP-growth, %
Asia/
Pacific*
India
Japan
* China, Hong Kong, South Korea, Taiwan,
Indonesia, Malaysia, Singapore, Thailand,
Phillippines, Vietnam, Australia, New Zealand,
India, Japan, Sri Lanka
Source: Consensus Economics
11
4.6
6.5
1.9
9.3
12
4.7
5.3
7.8 China
10
7.1
8.5
(0.5)
10.4
09
1.9
8.0
4.5
9.2
08
3.8
6.8
(5.5)
9.6
0
(1.1)
First up and then down again. The transportation industry is cyclical with swings up and down in
the short term. Then add emission standards, political decisions and expectations about the future,
all of which impact customers’ decisions to purchase now or wait until later. However, in the longer
term, the industry’s growth is closely linked to an increasing need for transports as economies grow.
Long-term growth
of the commercial vehicle industry is the intro-
duction of new emission legislation. New stand-
ards have traditionally resulted in more expen-
sive, more technically complex trucks. This has
generated an advance purchasing effect, a
prebuy, as haulage companies have taken the
opportunity to update their fleets just before the
new regulations come into force. At the same
time, new regulations have positive effects on
the environment.
Growth rates in different parts of the world
According to Consensus Economics, global GDP
grew by 2.5% during 2012 compared with 3.1% in
2011. GDP in the EU declined by 0.3% following
and increase by 1.6% in 2011. US GDP increased
by 2.2% (1.8%). Japan’s GDP expanded by 1.9%
following a decline of 0.5% in 2011. Growth in
countries such as Brazil, India and China hit cycli-
cal lows during 2012. For 2013, global GDP is
expected to grow by 2.6%. The emerging markets
in primarily Asia and Latin America are foreseen
to be the prime drivers of global growth.
(
6)
(
5)
(
4)
(
3)
(
2)
(
1)
0
1
2
3
4
5
6
% %
Euro Area GDP and heavy-duty trucks registration growth
(
60
)
(
50
)
(
40
)
(
30
)
(
20
)
(
10
)
0
10
20
30
40
50
60
1210 1106 07 08 090504
GDP growth (left axis)
New heavy-duty trucks registration growth (right axis)
The Volvo business moves in close tandem
with macroeconomic development
A GLOBAL GROUP 2012 OPERATING CONTEXT FUTURE TRANSPORT NEEDS
6