Volvo 2012 Annual Report Download - page 95
Download and view the complete annual report
Please find page 95 of the 2012 Volvo annual report below. You can navigate through the pages in the report by either clicking on the pages listed below, or by using the keyword search tool below to find specific information within the annual report.-
 1
1 -
2
-
3
-
4
-
5
-
6
-
7
-
8
-
9
-
10
-
11
-
12
-
13
-
14
-
15
-
16
-
17
-
18
-
19
-
20
-
21
-
22
-
23
-
24
-
25
-
26
-
27
-
28
-
29
-
30
-
31
-
32
-
33
-
34
-
35
-
36
-
37
-
38
-
39
-
40
-
41
-
42
-
43
-
44
-
45
-
46
-
47
-
48
-
49
-
50
-
51
-
52
-
53
-
54
-
55
-
56
-
57
-
58
-
59
-
60
-
61
-
62
-
63
-
64
-
65
-
66
-
67
-
68
-
69
-
70
-
71
-
72
-
73
-
74
-
75
-
76
-
77
-
78
-
79
-
80
-
81
-
82
-
83
-
84
-
 85
85 -
 86
86 -
 87
87 -
 88
88 -
 89
89 -
 90
90 -
 91
91 -
 92
92 -
 93
93 -
 94
94 -
 95
95 -
 96
96 -
 97
97 -
 98
98 -
 99
99 -
 100
100 -
 101
101 -
 102
102 -
 103
103 -
 104
104 -
 105
105 -
106
-
107
-
108
-
109
-
110
-
111
-
112
-
113
-
114
-
115
-
116
-
117
-
118
-
119
-
120
-
121
-
122
-
123
-
124
-
125
-
126
-
127
-
128
-
129
-
130
-
131
-
132
-
133
-
134
-
135
-
136
-
137
-
138
-
139
-
140
-
141
-
142
-
143
-
144
-
145
-
146
-
147
-
148
-
149
-
150
-
151
-
152
-
153
-
154
-
155
-
156
-
157
-
158
-
159
-
160
-
161
-
162
-
163
-
164
-
165
-
166
-
167
-
168
-
169
-
170
-
171
-
172
-
173
-
174
-
175
-
176
-
177
-
178
-
179
-
180
-
181
-
182
-
183
-
184
-
185
-
186
-
187
-
188
-
189
-
190
 |
 |

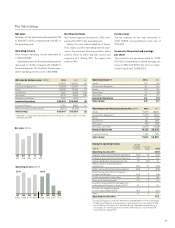
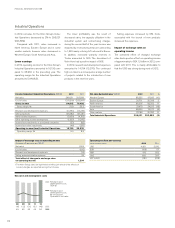
Net sales
Net sales for the Volvo Group decreased by 2%
to 303,647 in 2012, compared with 310,367 in
the preceding year.
Operating income
Volvo Group’s operating income amounted to
17,622 (26,899).
Operating income for the Industrial Operations
decreased to 16,130 compared with 25,930 in
the preceding year. The Customer Finance oper-
ations’ operating income rose to 1,492 (969).
Net financial items
Net interest expense amounted to 1,966, com-
pared with 2,267 in the preceding year.
During the year, market valuation of deriva-
tives, mainly used for eliminating interest expo-
sure in the customer financing portfolio, had a
positive effect on Other financial income and
expenses of 7. During 2011 the impact was
positive 544.
Income taxes
The tax expense for the year amounted to
4,097 (6,814) corresponding to a tax rate of
27% (27).
Income for the period and earnings
per share
The income for the period amounted to 11,258
(18,115), corresponding to diluted earnings per
share of SEK 5.44 (8.75). The return on share-
holders’ equity was 12.9% (23.1).
The Volvo Group
Net sales by business area, SEK M 2012 2011 %
Trucks 192,283 198,920 (3)
Construction Equipment 63,558 63,500 0
Buses 20,295 21,823 (7)
Volvo Penta 7,631 8,458 (10)
Volvo Aero 5,219 6,356 (18)
Eliminations and other 7,045 4,532 –
Industrial Operations1296,031 303,589 (2)
Customer Finance 9,783 8,882 10
Reclassifications and eliminations (2,167) (2,104) –
Volvo Group 303,647 310,367 (2)
1 Adjusted for acquired and divested units and changes in currency rates, net sales
decreased by 2%.
Change in operating income,
SEK bn
Change
(excluding
currency)
Currency
impact Total
Operating income 2011 26.9
Change in gross income Industrial operations1(7.0) 1.3 (5.7)
Change in gross income Customer financing 0.6 00.6
Highercapitalization of development cost 1.2 (0.1) 1.1
Higherresearch and development
expenditures (2.7) 0.1 (2.6)
Higherselling and administrative expenses (2.3) 0(2.3)
Restructuring and efficiency programs
in Japan and Europe (1.6) 0(1.6)
Profitfrom the sale of Volvo Aero 0.6 00.6
Volvo profit sharing program 0.3 00.3
Insurance compensation for damages from
earthquake and Tsunami in Japan in 2011 0.1 00.1
Provision for negative outcome
in court ruling related to EPA (0,1) 0(0,1)
Other 0.3 00.3
Operating income 2012 17. 6
1 During 2012 gross income was affected by underabsorption of costs amounting
to SEK neg 2.7 billlions and adjustment in warranty provisions amouting to SEK
neg 0.5 billions. Distruptions in the Volvo Group’s Japanese operations, as a
consequence of earthquake and tsunami affected gross income by SEK
neg 0.7 billions during 2011.
Operating income (loss) by business area, SEK M 2012 2011
Trucks 10,216 18,227
Construction Equipment 5,773 6,812
Buses 51 1,114
Volvo Penta 541 825
Volvo Aero 767 360
Eliminations and other (1,217) (1,408)
Industrial Operations 16,130 25,930
Customer Finance 1,492 969
Volvo Group 17,622 26,899
Operating margin, % 2012 2011
Trucks 5.3 9.2
Construction Equipment 9.1 10.7
Buses 0.3 5.1
Volvo Penta 7.1 9.8
Volvo Aero 14.7 5.7
Industrial Operations 5.4 8.5
Volvo Group 5.8 8.7
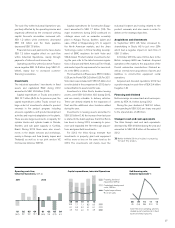
Net sales, SEK bn
12111009
310265218304
08
304
Operating income, SEK M
2011
Q4
6,955
Q3
5,774
Q2
7,648
Q1
6,522
2012
Q4
1,121
Q3
2,927
Q2
7,335
Q1
6,239
91