Volvo 2012 Annual Report Download - page 161
Download and view the complete annual report
Please find page 161 of the 2012 Volvo annual report below. You can navigate through the pages in the report by either clicking on the pages listed below, or by using the keyword search tool below to find specific information within the annual report.-
 1
1 -
2
-
3
-
4
-
5
-
6
-
7
-
8
-
9
-
10
-
11
-
12
-
13
-
14
-
15
-
16
-
17
-
18
-
19
-
20
-
21
-
22
-
23
-
24
-
25
-
26
-
27
-
28
-
29
-
30
-
31
-
32
-
33
-
34
-
35
-
36
-
37
-
38
-
39
-
40
-
41
-
42
-
43
-
44
-
45
-
46
-
47
-
48
-
49
-
50
-
51
-
52
-
53
-
54
-
55
-
56
-
57
-
58
-
59
-
60
-
61
-
62
-
63
-
64
-
65
-
66
-
67
-
68
-
69
-
70
-
71
-
72
-
73
-
74
-
75
-
76
-
77
-
78
-
79
-
80
-
81
-
82
-
83
-
84
-
85
-
86
-
87
-
88
-
89
-
90
-
91
-
92
-
93
-
94
-
95
-
96
-
97
-
98
-
99
-
100
-
101
-
102
-
103
-
104
-
105
-
106
-
107
-
108
-
109
-
110
-
111
-
112
-
113
-
114
-
115
-
116
-
117
-
118
-
119
-
120
-
121
-
122
-
123
-
124
-
125
-
126
-
127
-
128
-
129
-
130
-
131
-
132
-
133
-
134
-
135
-
136
-
137
-
138
-
139
-
140
-
141
-
142
-
143
-
144
-
145
-
146
-
147
-
148
-
149
-
150
-
 151
151 -
 152
152 -
 153
153 -
 154
154 -
 155
155 -
 156
156 -
 157
157 -
 158
158 -
 159
159 -
 160
160 -
 161
161 -
 162
162 -
 163
163 -
 164
164 -
 165
165 -
 166
166 -
 167
167 -
 168
168 -
 169
169 -
 170
170 -
 171
171 -
172
-
173
-
174
-
175
-
176
-
177
-
178
-
179
-
180
-
181
-
182
-
183
-
184
-
185
-
186
-
187
-
188
-
189
-
190
 |
 |

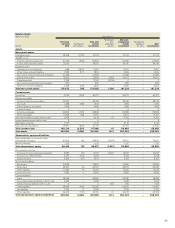
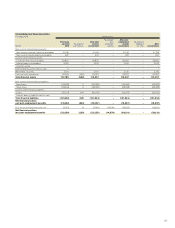
Consolidated net financial position
Full year, 2012 Volvo Group
SEK M
Previously
reported
2012
Restatement
joint ventures
After joint
venture
restatement
Restatement
post-
employment
benefits
After post-
employment
benefit
restatement
Restatement
hedging of
firm flows
After
restatements
Non-current interest-bearing assets
Non-current customer-financing receivables 41,156 –41,156 –41,156 –41,156
Non-current interest-bearing receivables 337 –337 –337 –337
Current interest-bearing assets
Customer-financing receivables 39,833 –39,833 –39,833 –39,833
Interest-bearing receivables 2, 574 –2, 574 –2,574 –2,574
Internal funding –––––––
Interest-bearing assets held for sale 0 – – – – – –
Marketable securities 3,130 –3,130 –3,130 –3,130
Cash and cash equivalents 25,759 (552) 25,207 –25,207 –25,207
Total financial assets 112,789 (552) 112,237 –112,237 –112 ,237
Non-current interest-bearing liabilities
Bond loans (43,092) 0(43,092) –(43,092) –(43,092)
Other loans (38,433) 5(38,428) –(38,428) –(38,428)
Current interest-bearing liabilities
Loans (50 ,317) 304 (50,013) –(50,013) –(50,013)
Interest-bearing liabilities held for sale – – – – – – –
Total financial liabilities (131,842) 308 (131,534) –(131,534) –(131,534)
Net financial position
excl post-employment benefits (19,053) (244) (19,297) –(19,297) –(19,297)
Prov for post-employm benefits, net (3,973) 14 (3,959) (14,876) (18,835) –(18,835)
Net financial position
incl post-employment benefits (23,026) (229) (23,255) (14,876) (38,131) –(38,131)
157