Volvo 2012 Annual Report Download - page 163
Download and view the complete annual report
Please find page 163 of the 2012 Volvo annual report below. You can navigate through the pages in the report by either clicking on the pages listed below, or by using the keyword search tool below to find specific information within the annual report.-
 1
1 -
2
-
3
-
4
-
5
-
6
-
7
-
8
-
9
-
10
-
11
-
12
-
13
-
14
-
15
-
16
-
17
-
18
-
19
-
20
-
21
-
22
-
23
-
24
-
25
-
26
-
27
-
28
-
29
-
30
-
31
-
32
-
33
-
34
-
35
-
36
-
37
-
38
-
39
-
40
-
41
-
42
-
43
-
44
-
45
-
46
-
47
-
48
-
49
-
50
-
51
-
52
-
53
-
54
-
55
-
56
-
57
-
58
-
59
-
60
-
61
-
62
-
63
-
64
-
65
-
66
-
67
-
68
-
69
-
70
-
71
-
72
-
73
-
74
-
75
-
76
-
77
-
78
-
79
-
80
-
81
-
82
-
83
-
84
-
85
-
86
-
87
-
88
-
89
-
90
-
91
-
92
-
93
-
94
-
95
-
96
-
97
-
98
-
99
-
100
-
101
-
102
-
103
-
104
-
105
-
106
-
107
-
108
-
109
-
110
-
111
-
112
-
113
-
114
-
115
-
116
-
117
-
118
-
119
-
120
-
121
-
122
-
123
-
124
-
125
-
126
-
127
-
128
-
129
-
130
-
131
-
132
-
133
-
134
-
135
-
136
-
137
-
138
-
139
-
140
-
141
-
142
-
143
-
144
-
145
-
146
-
147
-
148
-
149
-
150
-
151
-
152
-
 153
153 -
 154
154 -
 155
155 -
 156
156 -
 157
157 -
 158
158 -
 159
159 -
 160
160 -
 161
161 -
 162
162 -
 163
163 -
 164
164 -
 165
165 -
 166
166 -
 167
167 -
 168
168 -
 169
169 -
 170
170 -
 171
171 -
 172
172 -
 173
173 -
174
-
175
-
176
-
177
-
178
-
179
-
180
-
181
-
182
-
183
-
184
-
185
-
186
-
187
-
188
-
189
-
190
 |
 |

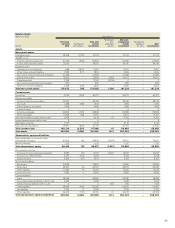
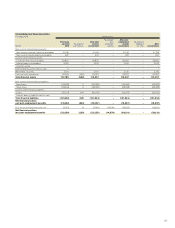
Year 2011 Industrial Operations Customer Finance Volvo Group Total
SEK M Previously
reported Restate-
ment After
restatement Previously
reported Restate-
ment After
restatement Previously
reported Restate-
ment After
restatement
Net sales 303,589 –303,589 8,883 –8,883 310,367 –310,367
Cost of sales (231,516) (1,581) (233,097) (5,693) –(5,693) (235,104) (1,581) (236,685)
Gross income 72,073 (1,581) 70,492 3,190 –3,190 75,263 (1,581) 73,682
Research and development
expenses (13,276) –(13,276) – – – (13,276) –(13,276)
Selling expenses (24,383) (798) (25,181) (1,618) –(1,618) (26,001) (798) (26,799)
Administrative expenses (7,105) 2,352 (4,753) (27) 27 –(7,132) 2,379 (4,753)
Other operating income
and expenses (1,045) –(1,045) (603) –(603) (1,649) –(1,649)
Income (loss) from
investments in associated
companies (82) –(82) –––(81) –(81)
Income from other
investments (225) –(225) –––(225) –(225)
Operating income 25,957 (27) 25,930 942 27 969 26,899 –26,899
Interest income and
similar credits 644 –644 –––608 –608
Interest expenses
and similar charges (2,912) –(2,912) –––(2,875) –(2,875)
Other financial income
and expenses 297 –297 – – – 297 –297
Income after
financial items 23,986 (27) 23,959 942 27 969 24,929 –24,929
Income taxes (6,490) –(6,490) (323) –(323) (6,814) –(6,814)
Income for the period 17, 496 (27) 17, 469 619 27 646 18 ,115 –18 ,115
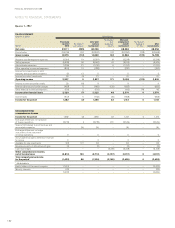
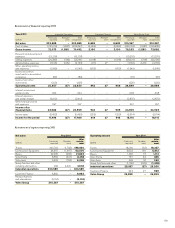
Restatement of financial reporting 2011
Operating income
SEK M
Year 2011
Previously
reported Restate-
ment
After
restate-
ment
Trucks 18,260 (33) 18,227
Construction Equipment 6,653 159 6,812
Buses 1,036 78 1,114
Volvo Penta 781 44 825
Volvo Aero 336 24 360
Group functions and other (1,109) (299) (1,408)
Industrial operations 25,957 (27) 25,930
Customer Finance 942 27 969
Volvo Group 26,899 –26,899
Net sales
SEK M
Year 2011
Previously
reported Restate-
ment
After
restate-
ment
Trucks 200,703 (1,783) 198,920
Construction Equipment 64,987 (1,487) 63,500
Buses 22,289 (466) 21,823
Volvo Penta 8,859 (401) 8,458
Volvo Aero 6,509 (153) 6,356
Group function and other
including eliminations 242 4,290 4,532
Industrial operations 303,589 –303,589
Customer Finance 8,882 –8,882
Reclassifications
and eliminations (2,104) –(2,104)
Volvo Group 310,367 –310,367
Restatement of segment reporting 2011
159