Volvo 2012 Annual Report Download - page 65
Download and view the complete annual report
Please find page 65 of the 2012 Volvo annual report below. You can navigate through the pages in the report by either clicking on the pages listed below, or by using the keyword search tool below to find specific information within the annual report.-
 1
1 -
2
-
3
-
4
-
5
-
6
-
7
-
8
-
9
-
10
-
11
-
12
-
13
-
14
-
15
-
16
-
17
-
18
-
19
-
20
-
21
-
22
-
23
-
24
-
25
-
26
-
27
-
28
-
29
-
30
-
31
-
32
-
33
-
34
-
35
-
36
-
37
-
38
-
39
-
40
-
41
-
42
-
43
-
44
-
45
-
46
-
47
-
48
-
49
-
50
-
51
-
52
-
53
-
54
-
 55
55 -
 56
56 -
 57
57 -
 58
58 -
 59
59 -
 60
60 -
 61
61 -
 62
62 -
 63
63 -
 64
64 -
 65
65 -
 66
66 -
 67
67 -
 68
68 -
 69
69 -
 70
70 -
 71
71 -
 72
72 -
 73
73 -
 74
74 -
 75
75 -
76
-
77
-
78
-
79
-
80
-
81
-
82
-
83
-
84
-
85
-
86
-
87
-
88
-
89
-
90
-
91
-
92
-
93
-
94
-
95
-
96
-
97
-
98
-
99
-
100
-
101
-
102
-
103
-
104
-
105
-
106
-
107
-
108
-
109
-
110
-
111
-
112
-
113
-
114
-
115
-
116
-
117
-
118
-
119
-
120
-
121
-
122
-
123
-
124
-
125
-
126
-
127
-
128
-
129
-
130
-
131
-
132
-
133
-
134
-
135
-
136
-
137
-
138
-
139
-
140
-
141
-
142
-
143
-
144
-
145
-
146
-
147
-
148
-
149
-
150
-
151
-
152
-
153
-
154
-
155
-
156
-
157
-
158
-
159
-
160
-
161
-
162
-
163
-
164
-
165
-
166
-
167
-
168
-
169
-
170
-
171
-
172
-
173
-
174
-
175
-
176
-
177
-
178
-
179
-
180
-
181
-
182
-
183
-
184
-
185
-
186
-
187
-
188
-
189
-
190
 |
 |

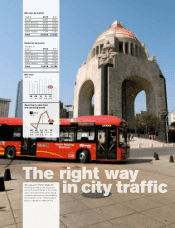
Success for Volvo Hybrids
Volvo Buses hybrids are successful
around the world thanks to the combi-
nation of environmental performance,
drivability, fuel economy and reliability.
On the photo is one of Volvo’s hybrid
buses in operation in Mexico City.
The right way
in city traffic
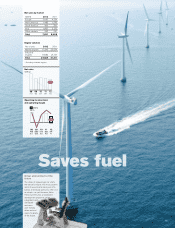
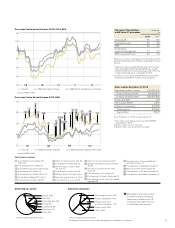
Net sales by market
SEK M 2012 2 011
Europe 6,200 6,631
North America 6,675 7,532
South America 2,794 2,715
Asia 2,853 2,953
Other markets 1,774 1,992
Total 20,295 21,823
Deliveries by market
Number of
buses 2012 2011
Europe 2,491 2,695
North America 1,826 3,014
South America 2,560 2,620
Asia 2,945 3,417
Other markets 856 1,040
Total 10,678 12,786
Net sales
SEK bn
12
21.8 20.3
11
20.5
10
18.5
09
17.3
08
20.3
Operating income (loss)
and operating margin
SEK M
%
11
1,114
5.1
12
51
0.3
10
780
3.8
(350)
(1.9)
09
(76)
(0.4)
08
51
61