Volvo 2012 Annual Report Download - page 100
Download and view the complete annual report
Please find page 100 of the 2012 Volvo annual report below. You can navigate through the pages in the report by either clicking on the pages listed below, or by using the keyword search tool below to find specific information within the annual report.-
 1
1 -
2
-
3
-
4
-
5
-
6
-
7
-
8
-
9
-
10
-
11
-
12
-
13
-
14
-
15
-
16
-
17
-
18
-
19
-
20
-
21
-
22
-
23
-
24
-
25
-
26
-
27
-
28
-
29
-
30
-
31
-
32
-
33
-
34
-
35
-
36
-
37
-
38
-
39
-
40
-
41
-
42
-
43
-
44
-
45
-
46
-
47
-
48
-
49
-
50
-
51
-
52
-
53
-
54
-
55
-
56
-
57
-
58
-
59
-
60
-
61
-
62
-
63
-
64
-
65
-
66
-
67
-
68
-
69
-
70
-
71
-
72
-
73
-
74
-
75
-
76
-
77
-
78
-
79
-
80
-
81
-
82
-
83
-
84
-
85
-
86
-
87
-
88
-
89
-
 90
90 -
 91
91 -
 92
92 -
 93
93 -
 94
94 -
 95
95 -
 96
96 -
 97
97 -
 98
98 -
 99
99 -
 100
100 -
 101
101 -
 102
102 -
 103
103 -
 104
104 -
 105
105 -
 106
106 -
 107
107 -
 108
108 -
 109
109 -
 110
110 -
111
-
112
-
113
-
114
-
115
-
116
-
117
-
118
-
119
-
120
-
121
-
122
-
123
-
124
-
125
-
126
-
127
-
128
-
129
-
130
-
131
-
132
-
133
-
134
-
135
-
136
-
137
-
138
-
139
-
140
-
141
-
142
-
143
-
144
-
145
-
146
-
147
-
148
-
149
-
150
-
151
-
152
-
153
-
154
-
155
-
156
-
157
-
158
-
159
-
160
-
161
-
162
-
163
-
164
-
165
-
166
-
167
-
168
-
169
-
170
-
171
-
172
-
173
-
174
-
175
-
176
-
177
-
178
-
179
-
180
-
181
-
182
-
183
-
184
-
185
-
186
-
187
-
188
-
189
-
190
 |
 |

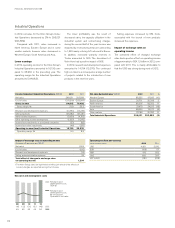
During 2012, operating cash flow in the Industrial Operations amounted to a negative SEK 4.8 billion (positive 14.1).
CASH-FLOW STATEMENT
Negative operating cash-flow
CONSOLIDATED CASH-FLOW STATEMENTS
Industrial operations Customer Finance Eliminations Volvo Group Total
SEK M 2012 2011 2012 2 011 2012 2 011 2012 2 011
Operating activities
Operating income 16,130 25,957 1,492 942 0 0 17,622 26,899
Depreciation tangible assets Note 13 5,928 6,109 20 15 0 0 5,948 6,124
Amortization intangible assets Note 12 3,168 3,227 23 20 0 0 3,191 3,247
Depreciation leasing vehicles Note 13 2,890 2,083 2,726 2,537 0 1 5,616 4,621
Other non-cash items Note 29 796 622 565 614 69 26 1,430 1,262
Total change in working capital whereof (9,184) (4,180) (14, 574) (13,831) 1,818 2,926 (21,940) (15,085)
Change in accounts receivable (1,227) (3,094) 79 (101) 0 0 (1,148) (3,195)
Change in customer financing receivables 228 (240) (14,812) (14, 202) 1,883 3,007 (12,701) (11,435)
Change in inventories 627 (7, 099) 258 (155) 0 0 885 (7,254)
Change in trade payables (7, 552) 9,871 (81) 107 0 0 (7,633) 9,978
Other changes in working capital (1, 260) (3,618) (18) 520 (65) (81) (1, 343) (3,179)
Interest and similar items received 527 720 0 – 6 (42) 533 678
Interest and similar items paid (2,825) (3,391) 0 – (75) 12 (2,900) (3,379)
Other financial items (319) (184) 0 – 0 0 (319) (184)
Income taxes paid (4,668) (4,129) (697) (384) (1) 0 (5,366) (4,513)
Cash flow from operating activities 12,443 26,834 (10,445) (10,087) 1,817 2,923 3,815 19,670
Investing activities
Investments in tangible assets (9,308) (8,267) (29) (50) (1) 27 (9,338) (8,290)
Investments in intangible assets (5,281) (4,293) (19) (20) 0 0 (5,300) (4,313)
Investment in leasing vehicles (3,566) (1,422) (6,496) (6,044) 76 53 (9,986) (7,413)
Disposals of fixed assets and leasing vehicles 911 1,233 2,205 2,099 (6) 0 3 ,110 3,332
Operating cash flow (4,801) 14,085 (14,784) (14,102) 1,886 3,003 (17,699) 2,986
Investments and divestments of shares, net Note 5,29 (1,186) (119)
Acquired and divested operations, net Note 3,29 3,390 (1,590)
Interest-bearing receivables incl marketable securities 3,678 2,665
Cash-flow after net investments (11,817) 3,942
Financing activities
Change in loans, net Note 29 14,075 8,734
Dividend to AB Volvo shareholders (6,083) (5,069)
Dividend to minority shareholders 0 (2)
Other 2 (30)
Change in cash and cash equivalents excl.
translation differences (3,823) 7, 575
Translation difference on cash and cash equivalents (797) (162)
Change in cash and cash equivalents (4,620) 7,413
Cash and cash equivalents, beginning of year Note 18 30,379 22,966
Cash and cash equivalents, end of year Note 18 25,759 30,379
96
FINANCIAL INFORMATION 2012