Volvo 2012 Annual Report Download - page 159
Download and view the complete annual report
Please find page 159 of the 2012 Volvo annual report below. You can navigate through the pages in the report by either clicking on the pages listed below, or by using the keyword search tool below to find specific information within the annual report.-
 1
1 -
2
-
3
-
4
-
5
-
6
-
7
-
8
-
9
-
10
-
11
-
12
-
13
-
14
-
15
-
16
-
17
-
18
-
19
-
20
-
21
-
22
-
23
-
24
-
25
-
26
-
27
-
28
-
29
-
30
-
31
-
32
-
33
-
34
-
35
-
36
-
37
-
38
-
39
-
40
-
41
-
42
-
43
-
44
-
45
-
46
-
47
-
48
-
49
-
50
-
51
-
52
-
53
-
54
-
55
-
56
-
57
-
58
-
59
-
60
-
61
-
62
-
63
-
64
-
65
-
66
-
67
-
68
-
69
-
70
-
71
-
72
-
73
-
74
-
75
-
76
-
77
-
78
-
79
-
80
-
81
-
82
-
83
-
84
-
85
-
86
-
87
-
88
-
89
-
90
-
91
-
92
-
93
-
94
-
95
-
96
-
97
-
98
-
99
-
100
-
101
-
102
-
103
-
104
-
105
-
106
-
107
-
108
-
109
-
110
-
111
-
112
-
113
-
114
-
115
-
116
-
117
-
118
-
119
-
120
-
121
-
122
-
123
-
124
-
125
-
126
-
127
-
128
-
129
-
130
-
131
-
132
-
133
-
134
-
135
-
136
-
137
-
138
-
139
-
140
-
141
-
142
-
143
-
144
-
145
-
146
-
147
-
148
-
 149
149 -
 150
150 -
 151
151 -
 152
152 -
 153
153 -
 154
154 -
 155
155 -
 156
156 -
 157
157 -
 158
158 -
 159
159 -
 160
160 -
 161
161 -
 162
162 -
 163
163 -
 164
164 -
 165
165 -
 166
166 -
 167
167 -
 168
168 -
 169
169 -
170
-
171
-
172
-
173
-
174
-
175
-
176
-
177
-
178
-
179
-
180
-
181
-
182
-
183
-
184
-
185
-
186
-
187
-
188
-
189
-
190
 |
 |
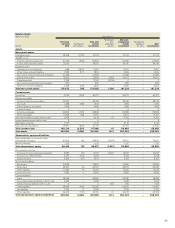
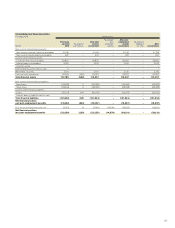
Balance sheets
December 31, 2012 Volvo Group
SEK M
Previously
reported
2012
Restatement
joint ventures
After joint
venture
restatement
Restatement
post-
employment
benefits
After post-
employment
benefit
restatement
Restatement
hedging of
firm flows
After
restatements
Assets
Non-current assets
Intangible assets 40,373 (1,675) 38,698 –38,698 –38,698
Tangible assets
Property, plant and equipment 55,004 (815) 54,189 –54,189 –54,189
Assets under operating leases 29,022 –29,022 –29,022 –29,022
Financial assets
Investments in Joint Venturesand
associated companies 2,045 2,478 4,523 –4,523 –4,523
Other shares and participations 845 775 1,620 –1,620 –1,620
Non-current customer-financing receivables 41,156 –41,156 –41,156 –41,156
Deferred tax assets 11,16 6 –11,16 6 4,710 15,876 –15,876
Prepaid pensions 2,724 –2,724 (2,724) 0 – 0
Non-current interest-bearing receivables 337 –337 –337 –337
Other non-current receivables 3,319 (231) 3,088 –3,088 –3,088
Total non-current assets 185,991 533 186,524 1,986 188,510 –188,510
Current assets
Inventories 40,409 (316) 40,093 –40,093 –40,093
Current receivables
Customer-financing receivables 39,833 –39,833 –39,833 –39,833
Tax assets 1,208 (195) 1,013 –1,013 –1,013
Interest-bearing receivables 2,574 –2,574 –2,574 –2, 574
Internal funding 0 – 0 – 0 – 0
Accounts receivable 27,349 (833) 26, 516 –26,516 –26 ,516
Other receivables 12,489 (199) 12,290 –12,290 –12,290
Non interest-bearing assets held for sale 0 – 0 – 0 – 0
Interest-bearing assets held for sale 0 – 0 – 0 – 0
Marketable securities 3,130 –3,130 –3,130 –3,130
Cash and cash equivalents 25,759 (552) 25,207 –25,207 –25,207
Total current assets 152,751 (2,095) 150,656 –150,656 –150,656
Total assets 338,742 (1,562) 337,180 1,986 339,166 –339,166
Shareholders’ equity and liabilities
Equity attributable to the equity holder
of the Parent Company 85,648 334 85,982 (10,197) 75,785 –75,785
Minority interests 1,266 01,266 –1,266 –1,266
Total shareholders’ equity 86,914 334 87, 24 8 (10,197) 77,051 –77,051
Non-current provisions
Provisions for post-employment benefits 6,697 (14) 6,683 12,152 18,835 –18,835
Provisions for deferred taxes 5,028 (178) 4,850 –4,850 –4,850
Other provisions 5,783 (43) 5,740 –5 ,740 –5,740
Non-current liabilities
Bond loans 43,092 –43,092 –43,092 –43,092
Other loans 38,433 (5) 38,428 –38,428 –38,428
Other liabilities 10,714 –10,714 –10,714 –10,714
Current provisions 10,976 –10,976 –10,976 –10,976
Current liabilities –
Loans 5 0,317 (304) 50,013 –50,013 –50,013
Non interest-bearing liabilities held for sale 0 – 0 – 0 – 0
Interest-bearing liabilities held for sale 0 – 0 – 0 – 0
Trade payables 47,364 (892) 46,472 –46,472 –46,472
Tax liabilities 653 (193) 460 –460 –460
Other liabilities 32,771 (267) 32,504 31 32,535 –32,535
Total shareholders’ equity and liabilities 338,742 (1,562) 337,180 1,986 339,166 –339,166
155