Volvo 2012 Annual Report Download - page 138
Download and view the complete annual report
Please find page 138 of the 2012 Volvo annual report below. You can navigate through the pages in the report by either clicking on the pages listed below, or by using the keyword search tool below to find specific information within the annual report.-
 1
1 -
2
-
3
-
4
-
5
-
6
-
7
-
8
-
9
-
10
-
11
-
12
-
13
-
14
-
15
-
16
-
17
-
18
-
19
-
20
-
21
-
22
-
23
-
24
-
25
-
26
-
27
-
28
-
29
-
30
-
31
-
32
-
33
-
34
-
35
-
36
-
37
-
38
-
39
-
40
-
41
-
42
-
43
-
44
-
45
-
46
-
47
-
48
-
49
-
50
-
51
-
52
-
53
-
54
-
55
-
56
-
57
-
58
-
59
-
60
-
61
-
62
-
63
-
64
-
65
-
66
-
67
-
68
-
69
-
70
-
71
-
72
-
73
-
74
-
75
-
76
-
77
-
78
-
79
-
80
-
81
-
82
-
83
-
84
-
85
-
86
-
87
-
88
-
89
-
90
-
91
-
92
-
93
-
94
-
95
-
96
-
97
-
98
-
99
-
100
-
101
-
102
-
103
-
104
-
105
-
106
-
107
-
108
-
109
-
110
-
111
-
112
-
113
-
114
-
115
-
116
-
117
-
118
-
119
-
120
-
121
-
122
-
123
-
124
-
125
-
126
-
127
-
 128
128 -
 129
129 -
 130
130 -
 131
131 -
 132
132 -
 133
133 -
 134
134 -
 135
135 -
 136
136 -
 137
137 -
 138
138 -
 139
139 -
 140
140 -
 141
141 -
 142
142 -
 143
143 -
 144
144 -
 145
145 -
 146
146 -
 147
147 -
 148
148 -
149
-
150
-
151
-
152
-
153
-
154
-
155
-
156
-
157
-
158
-
159
-
160
-
161
-
162
-
163
-
164
-
165
-
166
-
167
-
168
-
169
-
170
-
171
-
172
-
173
-
174
-
175
-
176
-
177
-
178
-
179
-
180
-
181
-
182
-
183
-
184
-
185
-
186
-
187
-
188
-
189
-
190
 |
 |

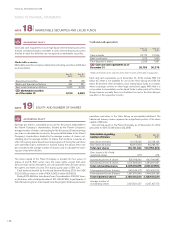
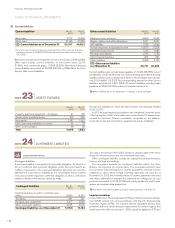
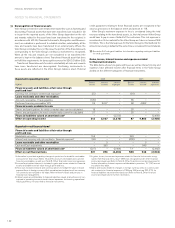
Current liabilities
Current liabilities Dec 31,
2012 Dec 31,
2011
Bank loans 9,172 12,639
Other loans 41,145 31,883
B/S Current liabilities as of December 31150,317 44,522
1 Of which loans raised to finance the credit portfolio of the customer financing
operations amount to 39,259 (31,844) and financial derivatives at fair value
43 (1,362).
Bank loans include current maturities of non-current loans 2,586 (5,803).
Other loans include current maturities of non-current loans, 22,173
(17,681), and commercial paper, 13,535 (8,393). Non-interest-bearing
current liabilities accounted for 80,788 (99,152), or 62% (69) of the Volvo
Group’s total current liabilities.
Other current liabilities Dec 31,
2012 Dec 31,
2011
Advances from customers 3,959 3,642
Wages, salaries and withholding taxes 7,901 8 ,041
VAT liabilities 1,785 2,099
Accrued expenses and prepaid income 10,925 12,528
Deferred leasing income 1,793 1,683
Residual value liability 1,705 1,783
Other financial liabilities 254 367
Other liabilities 4,449 5,120
B/S Other current liabilities
as of December 31 32,771 35,263
Current liabilities also include trade payables of 47,364 (56,788), current
tax liabilities of 653 (2,391) and non interest-bearing and interest-bearing
liabilities held for sale, as disclosed in Note 3. Secured bank loans at year-
end 2012 totalled 113 (127). The corresponding amount for other current
liabilities amounted to 1,581 (584). Of current liabilities including trade
payables, 97,992 (102,331) pertains to financial instruments.
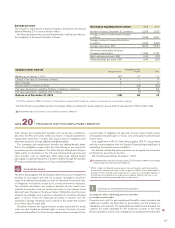
Refer to Note 23 for an explanation of changes to assets pledged.
Dec 31,
2012 Dec 31,
2011
Property, plant and equipment – mortgages 97 128
Assets under operating leases 150 265
Receivables 3,781 1,333
Cash, loans andmarketable securities 32 78
Other assets pledged 39 28
Total 4,099 1,832
At year-end, liabilities for which the above assets were pledged totalled
3,722 (1,227).
In 2012 an asset-backed securitization was completed. Under the terms
of the transaction, 4,361 of securities were issued tied to US-based loans,
secured by Customer Finance receivables recognized on the balance-
sheet with trucks and construction equipment assets as collaterals.
NOTE 23
ASSETS PLEDGED
Contingent liabilities
A contingent liability is recognized for a possible obligation, for which it is
not yet confirmed that a present obligation exists that could lead to an
outflow of resources; or for a present obligation that does not meet the
definitions of a provision or a liability as it is not probable that an outflow
of resources will be required to settle the obligation or when a sufficiently
reliable estimate of the amount cannot be made.
Contingent liabilities Dec 31,
2012 Dec 31,
2011
Credit guarantees issued for customers and
others 9,540 8,970
Tax claims 861 521
Residual value guarantees 3,317 2,969
Other contingent liabilities 4,045 4,694
Contingent liabilities as of December 31 17,763 17,154
Tax claims amounting to 861 (521) pertain to charges against the Volvo
Group for which provisions are not considered necessary.
Other contingent liabilities include for example bid and performance
clauses and legal proceedings.
The recognized amounts for contingent liabilities reflect the Volvo
Group’s risk exposure on a gross basis. The recognized amounts have
thus not been reduced because of counter guarantees received or other
collaterals in cases where a legal offsetting right does not exist. As of
December 31, 2012, the estimated value of counter guarantees received
and other collaterals, for example the estimated net selling price of used
products, amounted to 4,216 (3,726) and mainly pertains to credit guar-
antees and residual value guarantees.
For more information regarding residual value guarantees, see note 21.
Legal proceedings
In July 1999, Volvo Truck Corporation (VTC) and Volvo Construction Equip-
ment (VCE) entered into a Consent Decree with the U.S. Environmental
Protection Agency (EPA). The Consent Decree stipulated, among other
provisions, that new stricter emission requirements for certain engines that
would come into effect on January 1, 2006, should be applied by VTC and
ACCOUNTING POLICY
NOTE 24
CONTINGENT LIABILITIES
NOTES TO FINANCIAL STATEMENTS
FINANCIAL INFORMATION 2012
134