Volvo 2012 Annual Report Download - page 170
Download and view the complete annual report
Please find page 170 of the 2012 Volvo annual report below. You can navigate through the pages in the report by either clicking on the pages listed below, or by using the keyword search tool below to find specific information within the annual report.-
 1
1 -
2
-
3
-
4
-
5
-
6
-
7
-
8
-
9
-
10
-
11
-
12
-
13
-
14
-
15
-
16
-
17
-
18
-
19
-
20
-
21
-
22
-
23
-
24
-
25
-
26
-
27
-
28
-
29
-
30
-
31
-
32
-
33
-
34
-
35
-
36
-
37
-
38
-
39
-
40
-
41
-
42
-
43
-
44
-
45
-
46
-
47
-
48
-
49
-
50
-
51
-
52
-
53
-
54
-
55
-
56
-
57
-
58
-
59
-
60
-
61
-
62
-
63
-
64
-
65
-
66
-
67
-
68
-
69
-
70
-
71
-
72
-
73
-
74
-
75
-
76
-
77
-
78
-
79
-
80
-
81
-
82
-
83
-
84
-
85
-
86
-
87
-
88
-
89
-
90
-
91
-
92
-
93
-
94
-
95
-
96
-
97
-
98
-
99
-
100
-
101
-
102
-
103
-
104
-
105
-
106
-
107
-
108
-
109
-
110
-
111
-
112
-
113
-
114
-
115
-
116
-
117
-
118
-
119
-
120
-
121
-
122
-
123
-
124
-
125
-
126
-
127
-
128
-
129
-
130
-
131
-
132
-
133
-
134
-
135
-
136
-
137
-
138
-
139
-
140
-
141
-
142
-
143
-
144
-
145
-
146
-
147
-
148
-
149
-
150
-
151
-
152
-
153
-
154
-
155
-
156
-
157
-
158
-
159
-
 160
160 -
 161
161 -
 162
162 -
 163
163 -
 164
164 -
 165
165 -
 166
166 -
 167
167 -
 168
168 -
 169
169 -
 170
170 -
 171
171 -
 172
172 -
 173
173 -
 174
174 -
 175
175 -
 176
176 -
 177
177 -
 178
178 -
 179
179 -
 180
180 -
181
-
182
-
183
-
184
-
185
-
186
-
187
-
188
-
189
-
190
 |
 |

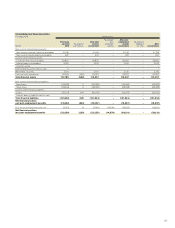
2012 2 011
Current taxes 4 –
Deferred taxes (1,096) (597)
I/S Total income taxes (1,092) (597)
Current taxes consist of an expense of 2 (0) related to this year and an
income of 6 (0) related to prior years.
Deferred taxes relate to estimated tax on the change in tax-loss carryfor-
wards and temporary differences. Deferred tax assets are recognized to
the extent that it is probable that the amount can be utilized against future
taxable income.
Deferred taxes related to change in tax-loss carryforwards amount to
an expense of 1,081 (602) and to changes in other temporary differences
to an expense of 15 (income 5).
The table to the right discloses the principal reasons for the difference
between the corporate income tax of 26.3% and the tax for the period.
2012 2 011
Income before taxes 6,193 6,078
Income tax according to applicable tax rate (1,629) (1,598)
Capital gains/losses 754 0
Non-taxable dividends 253 723
Non-taxable revaluations of shareholdings (37) (16)
Other non-deductible expenses (71) (6)
Other non-taxable income 18 300
Adjustment of current taxes for prior periods 6 –
Withholding tax (2) –
Recognition and derecognition of deferred tax
assets due to change in tax rate (384) –
I/S Income taxes for the period (1,092) (597)
Specification of deferred tax assets Dec 31,
2012 Dec 31,
2011
Tax-loss carryforwards 1,804 2,885
Provision for post-employment benefits 141 163
Provision for restructuring measures 911
Other deductible temporary differences 10 1
B/S Deferred tax assets 1,964 3,060
INCOME TAXES
NOTE 11
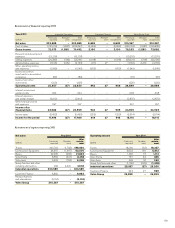
Acquisition cost Dec 31, 2011
Carrying value Investments Sales/scrapping Reclassifications Dec 31, 2012
Carrying value
Rights 52 – – – 52
Other intangible assets 138 –(22) –116
Total intangible assets 190 –(22) –168
Buildings 27 ––– 27
Land and land improvements 14 – – – 14
Machinery and equipment 47 –(7) 242
Construction in progress 32 74 (78) (2) 26
Total tangible assets 120 74 (85) 0109
Accumulated depreciation Dec 31, 2011
Carrying value1Depreciation2Sales/scrapping Dec 31, 2012
Carrying value Dec 31, 2012
Net carrying value3
Rights 52 – – 52 0
Other intangible assets 50 14 –64 52
B/S Total intangible assets 102 14 –116 52
Buildings 3 1 – 4 23
Land and land improvements 0 0 – 0 14
Machinery and equipment 37 1(7) 31 11
Construction in progress –––– 26
B/S Total tangible assets 40 2(7) 35 74
1 Including accumulated write-downs.
2 Including write-downs.
3 Acquisition value, less accumulated depreciation, amortization and write-downs.
Capital expenditures in tangible assets amounted to 74 (65). Capital expendi-
tures approved but not yet implemented at year-end 2012 amounted to 1 (1).
INTANGIBLE AND TANGIBLE ASSETS
NOTE 12
FINANCIAL INFORMATION 2012
166
NOTES TO FINANCIAL STATEMENTS