Virgin Media 2011 Annual Report Download - page 98
Download and view the complete annual report
Please find page 98 of the 2011 Virgin Media annual report below. You can navigate through the pages in the report by either clicking on the pages listed below, or by using the keyword search tool below to find specific information within the annual report.-
 1
1 -
2
-
3
-
4
-
5
-
6
-
7
-
8
-
9
-
10
-
11
-
12
-
13
-
14
-
15
-
16
-
17
-
18
-
19
-
20
-
21
-
22
-
23
-
24
-
25
-
26
-
27
-
28
-
29
-
30
-
31
-
32
-
33
-
34
-
35
-
36
-
37
-
38
-
39
-
40
-
41
-
42
-
43
-
44
-
45
-
46
-
47
-
48
-
49
-
50
-
51
-
52
-
53
-
54
-
55
-
56
-
57
-
58
-
59
-
60
-
61
-
62
-
63
-
64
-
65
-
66
-
67
-
68
-
69
-
70
-
71
-
72
-
73
-
74
-
75
-
76
-
77
-
78
-
79
-
80
-
81
-
82
-
83
-
84
-
85
-
86
-
87
-
 88
88 -
 89
89 -
 90
90 -
 91
91 -
 92
92 -
 93
93 -
 94
94 -
 95
95 -
 96
96 -
 97
97 -
 98
98 -
 99
99 -
 100
100 -
 101
101 -
 102
102 -
 103
103 -
 104
104 -
 105
105 -
 106
106 -
 107
107 -
 108
108 -
109
-
110
-
111
-
112
-
113
-
114
-
115
-
116
-
117
-
118
-
119
-
120
-
121
-
122
-
123
-
124
-
125
-
126
-
127
-
128
-
129
-
130
-
131
-
132
-
133
-
134
-
135
-
136
-
137
-
138
-
139
-
140
-
141
-
142
-
143
-
144
-
145
-
146
-
147
-
148
-
149
-
150
-
151
-
152
-
153
-
154
-
155
-
156
-
157
-
158
-
159
-
160
-
161
-
162
-
163
-
164
-
165
-
166
-
167
-
168
-
169
-
170
-
171
-
172
-
173
-
174
-
175
-
176
-
177
-
178
-
179
-
180
-
181
-
182
-
183
-
184
-
185
-
186
-
187
-
188
-
189
-
190
-
191
-
192
-
193
-
194
-
195
-
196
-
197
-
198
-
199
-
200
-
201
-
202
-
203
-
204
-
205
-
206
-
207
-
208
-
209
-
210
-
211
-
212
-
213
-
214
-
215
-
216
-
217
-
218
 |
 |

VIRGIN MEDIA INC. AND SUBSIDIARIES
NOTES TO CONSOLIDATED FINANCIAL STATEMENTS (continued)
Note 2—Significant Accounting Policies (continued)
Cash and Cash Equivalents and Restricted Cash
Cash equivalents are short term highly liquid investments purchased with an original maturity of three
months or less and are recorded at amortized cost, which approximates fair value. We had cash equivalents
totaling £254.1 million and £433.1 million as at December 31, 2011 and 2010, respectively.
Restricted cash balances of £1.9 million as at December 31, 2011 and £2.2 million as at December 31, 2010
represent cash balances collateralized against performance bonds given on our behalf.
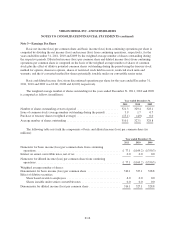
Trade Receivables
Our trade receivables are stated at outstanding principal balance, net of allowance for doubtful accounts.
Allowances for doubtful accounts are estimated based on the current aging of trade receivables, prior collection
experience and future expectations of conditions that might impact recoverability. Amounts charged to expense
are included in selling, general and administrative expenses in the consolidated statements of operations. The
movements in our allowance for doubtful accounts for the years ended December 31, 2011, 2010 and 2009 are as
follows (in millions):
Year ended December 31,
2011 2010 2009
Balance, January 1 ...................................................... £ 6.4 £ 9.0 £15.2
Charged to costs and expenses ............................................. 32.6 25.4 24.4
Write offs, net of recoveries ............................................... (28.1) (28.0) (30.6)
Balance, December 31 ................................................... £10.9 £ 6.4 £ 9.0
Inventory
Inventory consists of consumer goods for re-sale. Consumer goods for re-sale are valued at the lower of cost
or market value using the first-in, first-out, or FIFO, method. Cost represents the invoiced purchase cost of
inventory. This valuation requires us to make judgments, based on currently available information, about
obsolete, slow-moving or defective inventory. Based upon these judgments and estimates, which are applied
consistently from period to period, we adjust the carrying amount of our inventory for re-sale to the lower of cost
or market value.
Fixed Assets
Depreciation is computed by the straight-line method over the estimated useful lives of the assets. Land and
fixed assets held for sale are not depreciated. Estimated useful lives are as follows:
Operating equipment:
Cable distribution plant .......... 5-30 years
Switches and headends ........... 3-10 years
Customer premises equipment ..... 5-10 years
Other operating equipment ........ 4-20 years
Other equipment:
Buildings ..................... 20-50 years
Leasehold improvements ......... 7years or, if less, the lease term
Computer infrastructure .......... 3-5years
Other equipment ................ 5-10 years
F-9