Virgin Media 2011 Annual Report Download - page 171
Download and view the complete annual report
Please find page 171 of the 2011 Virgin Media annual report below. You can navigate through the pages in the report by either clicking on the pages listed below, or by using the keyword search tool below to find specific information within the annual report.-
 1
1 -
2
-
3
-
4
-
5
-
6
-
7
-
8
-
9
-
10
-
11
-
12
-
13
-
14
-
15
-
16
-
17
-
18
-
19
-
20
-
21
-
22
-
23
-
24
-
25
-
26
-
27
-
28
-
29
-
30
-
31
-
32
-
33
-
34
-
35
-
36
-
37
-
38
-
39
-
40
-
41
-
42
-
43
-
44
-
45
-
46
-
47
-
48
-
49
-
50
-
51
-
52
-
53
-
54
-
55
-
56
-
57
-
58
-
59
-
60
-
61
-
62
-
63
-
64
-
65
-
66
-
67
-
68
-
69
-
70
-
71
-
72
-
73
-
74
-
75
-
76
-
77
-
78
-
79
-
80
-
81
-
82
-
83
-
84
-
85
-
86
-
87
-
88
-
89
-
90
-
91
-
92
-
93
-
94
-
95
-
96
-
97
-
98
-
99
-
100
-
101
-
102
-
103
-
104
-
105
-
106
-
107
-
108
-
109
-
110
-
111
-
112
-
113
-
114
-
115
-
116
-
117
-
118
-
119
-
120
-
121
-
122
-
123
-
124
-
125
-
126
-
127
-
128
-
129
-
130
-
131
-
132
-
133
-
134
-
135
-
136
-
137
-
138
-
139
-
140
-
141
-
142
-
143
-
144
-
145
-
146
-
147
-
148
-
149
-
150
-
151
-
152
-
153
-
154
-
155
-
156
-
157
-
158
-
159
-
160
-
 161
161 -
 162
162 -
 163
163 -
 164
164 -
 165
165 -
 166
166 -
 167
167 -
 168
168 -
 169
169 -
 170
170 -
 171
171 -
 172
172 -
 173
173 -
 174
174 -
 175
175 -
 176
176 -
 177
177 -
 178
178 -
 179
179 -
 180
180 -
 181
181 -
182
-
183
-
184
-
185
-
186
-
187
-
188
-
189
-
190
-
191
-
192
-
193
-
194
-
195
-
196
-
197
-
198
-
199
-
200
-
201
-
202
-
203
-
204
-
205
-
206
-
207
-
208
-
209
-
210
-
211
-
212
-
213
-
214
-
215
-
216
-
217
-
218
 |
 |

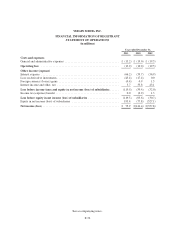
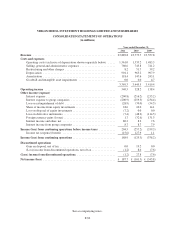
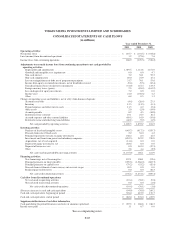
VIRGIN MEDIA INVESTMENT HOLDINGS LIMITED AND SUBSIDIARIES
CONSOLIDATED STATEMENTS OF OPERATIONS
(in millions)
Year ended December 31,
2011 2010 2009
Revenue ........................................................ £3,889.8 £3,773.7 £3,557.8
Costs and expenses
Operating costs (exclusive of depreciation shown separately below) ..... 1,561.0 1,535.2 1,483.3
Selling, general and administrative expenses ........................ 760.6 745.8 741.2
Restructuring and other charges .................................. 8.2 51.7 39.2
Depreciation ................................................. 901.1 965.2 907.9
Amortization ................................................. 118.4 147.6 243.1
Goodwill and intangible asset impairments ......................... 0.0 0.0 4.7
3,349.3 3,445.5 3,419.4
Operating income ................................................ 540.5 328.2 138.4
Other income (expense)
Interest expense ............................................... (200.8) (216.2) (235.2)
Interest expense to group companies .............................. (200.9) (259.3) (234.4)
Loss on extinguishment of debt .................................. (28.9) (70.0) (54.5)
Share of income from equity investments ........................... 18.6 24.0 14.1
Loss on disposal of equity investments ............................. (7.2) 0.0 0.0
Loss on derivative instruments ................................... (7.4) (48.2) (114.5)
Foreign currency gains (losses) ................................... 1.7 (32.6) 131.3
Interest income and other, net .................................... 80.2 8.2 7.6
Interest income from group companies ............................. 8.7 8.7 7.9
Income (loss) from continuing operations before income taxes ........... 204.5 (257.2) (339.3)
Income tax (expense) benefit .................................... (15.6) 127.9 1.1
Income (loss) from continuing operations ............................. 188.9 (129.3) (338.2)
Discontinued operations
Gain on disposal, net of tax ...................................... 0.0 19.2 0.0
(Loss) income from discontinued operations, net of tax ................ (1.2) 8.6 (7.6)
(Loss) income from discontinued operations .......................... (1.2) 27.8 (7.6)
Net income (loss) ................................................. £ 187.7 £ (101.5) £ (345.8)
See accompanying notes.
F-82