Virgin Media 2011 Annual Report Download - page 95
Download and view the complete annual report
Please find page 95 of the 2011 Virgin Media annual report below. You can navigate through the pages in the report by either clicking on the pages listed below, or by using the keyword search tool below to find specific information within the annual report.-
 1
1 -
2
-
3
-
4
-
5
-
6
-
7
-
8
-
9
-
10
-
11
-
12
-
13
-
14
-
15
-
16
-
17
-
18
-
19
-
20
-
21
-
22
-
23
-
24
-
25
-
26
-
27
-
28
-
29
-
30
-
31
-
32
-
33
-
34
-
35
-
36
-
37
-
38
-
39
-
40
-
41
-
42
-
43
-
44
-
45
-
46
-
47
-
48
-
49
-
50
-
51
-
52
-
53
-
54
-
55
-
56
-
57
-
58
-
59
-
60
-
61
-
62
-
63
-
64
-
65
-
66
-
67
-
68
-
69
-
70
-
71
-
72
-
73
-
74
-
75
-
76
-
77
-
78
-
79
-
80
-
81
-
82
-
83
-
84
-
 85
85 -
 86
86 -
 87
87 -
 88
88 -
 89
89 -
 90
90 -
 91
91 -
 92
92 -
 93
93 -
 94
94 -
 95
95 -
 96
96 -
 97
97 -
 98
98 -
 99
99 -
 100
100 -
 101
101 -
 102
102 -
 103
103 -
 104
104 -
 105
105 -
106
-
107
-
108
-
109
-
110
-
111
-
112
-
113
-
114
-
115
-
116
-
117
-
118
-
119
-
120
-
121
-
122
-
123
-
124
-
125
-
126
-
127
-
128
-
129
-
130
-
131
-
132
-
133
-
134
-
135
-
136
-
137
-
138
-
139
-
140
-
141
-
142
-
143
-
144
-
145
-
146
-
147
-
148
-
149
-
150
-
151
-
152
-
153
-
154
-
155
-
156
-
157
-
158
-
159
-
160
-
161
-
162
-
163
-
164
-
165
-
166
-
167
-
168
-
169
-
170
-
171
-
172
-
173
-
174
-
175
-
176
-
177
-
178
-
179
-
180
-
181
-
182
-
183
-
184
-
185
-
186
-
187
-
188
-
189
-
190
-
191
-
192
-
193
-
194
-
195
-
196
-
197
-
198
-
199
-
200
-
201
-
202
-
203
-
204
-
205
-
206
-
207
-
208
-
209
-
210
-
211
-
212
-
213
-
214
-
215
-
216
-
217
-
218
 |
 |

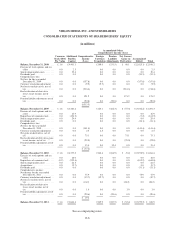
VIRGIN MEDIA INC. AND SUBSIDIARIES
CONSOLIDATED STATEMENTS OF SHAREHOLDERS’ EQUITY
(in millions)
Accumulated Other
Comprehensive Income (Loss)
Common
Stock $0.01
Par Value
Additional
Paid-In
Capital
Comprehensive
Income
(Loss)
Foreign
Currency
Translation
Pension
Liability
Adjustments
Net (Losses)
Gains on
Derivatives
Accumulated
Deficit Total
Balance, December 31, 2008 . . . £ 1.8 £4,461.3 £169.6 £(31.5) £ 40.1 £(2,625.1) £2,016.2
Exercise of stock options and tax
effect ..................... 0.0 2.5 0.0 0.0 0.0 0.0 2.5
Stock compensation costs ....... 0.0 19.4 0.0 0.0 0.0 0.0 19.4
Dividends paid ................ 0.0 0.0 0.0 0.0 0.0 (33.3) (33.3)
Comprehensive loss:
Net loss for the year ended
December 31, 2009 .......... 0.0 0.0 (357.8) 0.0 0.0 0.0 (357.8) (357.8)
Currency translation adjustment . . 0.0 0.0 (9.5) (9.5) 0.0 0.0 0.0 (9.5)
Net losses on derivatives, net of
tax ....................... 0.0 0.0 (216.6) 0.0 0.0 (216.6) 0.0 (216.6)
Reclassification of derivative
losses to net income, net of
tax ....................... 0.0 0.0 121.2 0.0 0.0 121.2 0.0 121.2
Pension liability adjustment, net of
tax ....................... 0.0 0.0 (50.8) 0.0 (50.8) 0.0 0.0 (50.8)
£(513.5)
Balance, December 31, 2009 . . . £ 1.8 £4,483.2 £160.1 £(82.3) £ (55.3) £(3,016.2) £1,491.3
Exercise of stock options and tax
effect ..................... 0.0 16.9 0.0 0.0 0.0 0.0 16.9
Repurchase of common stock .... 0.0 (154.3) 0.0 0.0 0.0 (7.2) (161.5)
Stock compensation costs ....... 0.0 29.4 0.0 0.0 0.0 0.0 29.4
Dividends paid ................ 0.0 0.0 0.0 0.0 0.0 (34.1) (34.1)
Comprehensive loss:
Net loss for the year ended
December 31, 2010 .......... 0.0 0.0 (141.4) 0.0 0.0 0.0 (141.4) (141.4)
Currency translation adjustment . . 0.0 0.0 2.5 2.5 0.0 0.0 0.0 2.5
Net gains on derivatives, net of
tax ....................... 0.0 0.0 75.1 0.0 0.0 75.1 0.0 75.1
Reclassification of derivative gains
to net income, net of tax ...... 0.0 0.0 (29.0) 0.0 0.0 (29.0) 0.0 (29.0)
Pension liability adjustment, net of
tax ....................... 0.0 0.0 15.4 0.0 15.4 0.0 0.0 15.4
£ (77.4)
Balance, December 31, 2010 .... £1.8 £4,375.2 £162.6 £(66.9) £ (9.2) £(3,198.9) £1,264.6
Exercise of stock options and tax
effect ..................... 0.0 18.0 0.0 0.0 0.0 0.0 18.0
Repurchase of common stock .... (0.2) (539.4) 0.0 0.0 0.0 (105.2) (644.8)
Stock compensation costs ....... 0.0 22.5 0.0 0.0 0.0 0.0 22.5
Acquisitions .................. 0.0 (9.7) 0.0 0.0 0.0 0.0 (9.7)
Dividends paid ................ 0.0 0.0 0.0 0.0 0.0 (31.1) (31.1)
Comprehensive income:
Net income for the year ended
December 31, 2011 .......... 0.0 0.0 75.9 0.0 0.0 0.0 75.9 75.9
Currency translation adjustment . . 0.0 0.0 (12.7) (12.7) 0.0 0.0 0.0 (12.7)
Net losses on derivatives, net of
tax ....................... 0.0 0.0 (24.2) 0.0 0.0 (24.2) 0.0 (24.2)
Reclassification of derivative
losses to net income, net of
tax ....................... 0.0 0.0 1.0 0.0 0.0 1.0 0.0 1.0
Pension liability adjustment, net of
tax ....................... 0.0 0.0 (20.6) 0.0 (20.6) 0.0 0.0 (20.6)
£ 19.4
Balance, December 31, 2011 .... £1.6 £3,866.6 £149.9 £(87.5) £ (32.4) £(3,259.3) £ 638.9
See accompanying notes.
F-6