Virgin Media 2011 Annual Report Download - page 38
Download and view the complete annual report
Please find page 38 of the 2011 Virgin Media annual report below. You can navigate through the pages in the report by either clicking on the pages listed below, or by using the keyword search tool below to find specific information within the annual report.-
 1
1 -
2
-
3
-
4
-
5
-
6
-
7
-
8
-
9
-
10
-
11
-
12
-
13
-
14
-
15
-
16
-
17
-
18
-
19
-
20
-
21
-
22
-
23
-
24
-
25
-
26
-
27
-
 28
28 -
 29
29 -
 30
30 -
 31
31 -
 32
32 -
 33
33 -
 34
34 -
 35
35 -
 36
36 -
 37
37 -
 38
38 -
 39
39 -
 40
40 -
 41
41 -
 42
42 -
 43
43 -
 44
44 -
 45
45 -
 46
46 -
 47
47 -
 48
48 -
49
-
50
-
51
-
52
-
53
-
54
-
55
-
56
-
57
-
58
-
59
-
60
-
61
-
62
-
63
-
64
-
65
-
66
-
67
-
68
-
69
-
70
-
71
-
72
-
73
-
74
-
75
-
76
-
77
-
78
-
79
-
80
-
81
-
82
-
83
-
84
-
85
-
86
-
87
-
88
-
89
-
90
-
91
-
92
-
93
-
94
-
95
-
96
-
97
-
98
-
99
-
100
-
101
-
102
-
103
-
104
-
105
-
106
-
107
-
108
-
109
-
110
-
111
-
112
-
113
-
114
-
115
-
116
-
117
-
118
-
119
-
120
-
121
-
122
-
123
-
124
-
125
-
126
-
127
-
128
-
129
-
130
-
131
-
132
-
133
-
134
-
135
-
136
-
137
-
138
-
139
-
140
-
141
-
142
-
143
-
144
-
145
-
146
-
147
-
148
-
149
-
150
-
151
-
152
-
153
-
154
-
155
-
156
-
157
-
158
-
159
-
160
-
161
-
162
-
163
-
164
-
165
-
166
-
167
-
168
-
169
-
170
-
171
-
172
-
173
-
174
-
175
-
176
-
177
-
178
-
179
-
180
-
181
-
182
-
183
-
184
-
185
-
186
-
187
-
188
-
189
-
190
-
191
-
192
-
193
-
194
-
195
-
196
-
197
-
198
-
199
-
200
-
201
-
202
-
203
-
204
-
205
-
206
-
207
-
208
-
209
-
210
-
211
-
212
-
213
-
214
-
215
-
216
-
217
-
218
 |
 |

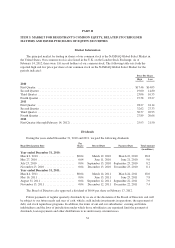
ITEM 6. SELECTED FINANCIAL DATA
The selected consolidated financial information presented below should be read in conjunction with the
consolidated financial statements and notes thereto and the information contained in our Management’s
Discussion and Analysis of Financial Condition and Results of Operations appearing elsewhere in this document.
Historical results are not necessarily indicative of future results.
The Statement of Operations and Balance Sheet data for the years ending and as at December 31, 2009,
2008 and 2007 have been adjusted for the disposals of Virgin Media TV and sit-up as described in the notes to
our consolidated financial statements.
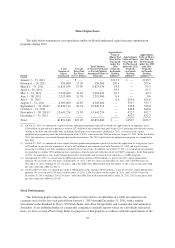
Year ended December 31,
2011 2010 2009 2008 2007
(in millions, except per share data)
Statement of Operations Data:
Revenue .................................. £3,991.8 £3,875.8 £3,663.9 £3,655.0 £3,729.2
Operating income (loss)(1) .................... 540.2 321.9 132.0 (261.9) 24.6
Income (loss) from continuing operations ....... 77.1 (169.2) (350.3) (827.4) (457.8)
Basic income (loss) from continuing operations
per share ............................... £ 0.25 £ (0.52) £ (1.07) £ (2.52) £ (1.40)
Diluted income (loss) from continuing operations
per share ............................... £ 0.24 £ (0.52) £ (1.07) £ (2.52) £ (1.40)
Average number of shares outstanding .......... 310.1 327.1 328.8 328.0 325.9
Dividends declared per common share
(in U.S. dollars) .......................... $ 0.16 $ 0.16 $ 0.16 $ 0.16 $ 0.13
(1) The 2008 operating loss includes goodwill and intangible asset impairments of £362.2 million.
Year ended December 31,
2011 2010 2009 2008 2007
Statement of Comprehensive Income (Loss)
Data:
Net income (loss) .......................... £75.9 £(141.4) £(357.8) £(920.0) £(463.5)
Components of other comprehensive income:
Currency translation adjustment ........... (12.7) 2.5 (9.5) 38.2 (0.2)
Net (losses) gains on derivatives, net of tax . . (24.2) 75.1 (216.6) 147.8 53.8
Reclassification of derivative gains (losses) to
net income, net of tax ................. 1.0 (29.0) 121.2 (125.1) (40.8)
Pension liability adjustment, net of tax ...... (20.6) 15.4 (50.8) (31.3) 19.8
Other comprehensive (loss) income ............ (56.5) 64.0 (155.7) 29.6 32.6
Total comprehensive income (loss) ............ 19.4 (77.4) (513.5) (890.4) (430.9)
As of December 31,
2011 2010 2009 2008 2007
Balance Sheet Data:
Cash and cash equivalents .................... £ 300.4 £ 479.5 £ 430.5 £ 181.6 £ 321.4
Working capital ............................ (433.6) (468.1) (290.9) (460.1) (488.4)
Fixed assets, net ............................ 4,602.7 4,763.1 5,045.8 5,337.9 5,644.5
Total assets ............................... 7,938.8 8,833.2 9,190.0 9,933.3 10,503.3
Long term obligations ....................... 5,855.1 6,020.4 5,974.7 6,170.1 5,958.5
Shareholders’ equity ........................ £ 638.9 £1,264.6 £1,491.3 £2,016.2 £ 2,810.5
37