Virgin Media 2011 Annual Report Download - page 62
Download and view the complete annual report
Please find page 62 of the 2011 Virgin Media annual report below. You can navigate through the pages in the report by either clicking on the pages listed below, or by using the keyword search tool below to find specific information within the annual report.-
 1
1 -
2
-
3
-
4
-
5
-
6
-
7
-
8
-
9
-
10
-
11
-
12
-
13
-
14
-
15
-
16
-
17
-
18
-
19
-
20
-
21
-
22
-
23
-
24
-
25
-
26
-
27
-
28
-
29
-
30
-
31
-
32
-
33
-
34
-
35
-
36
-
37
-
38
-
39
-
40
-
41
-
42
-
43
-
44
-
45
-
46
-
47
-
48
-
49
-
50
-
51
-
 52
52 -
 53
53 -
 54
54 -
 55
55 -
 56
56 -
 57
57 -
 58
58 -
 59
59 -
 60
60 -
 61
61 -
 62
62 -
 63
63 -
 64
64 -
 65
65 -
 66
66 -
 67
67 -
 68
68 -
 69
69 -
 70
70 -
 71
71 -
 72
72 -
73
-
74
-
75
-
76
-
77
-
78
-
79
-
80
-
81
-
82
-
83
-
84
-
85
-
86
-
87
-
88
-
89
-
90
-
91
-
92
-
93
-
94
-
95
-
96
-
97
-
98
-
99
-
100
-
101
-
102
-
103
-
104
-
105
-
106
-
107
-
108
-
109
-
110
-
111
-
112
-
113
-
114
-
115
-
116
-
117
-
118
-
119
-
120
-
121
-
122
-
123
-
124
-
125
-
126
-
127
-
128
-
129
-
130
-
131
-
132
-
133
-
134
-
135
-
136
-
137
-
138
-
139
-
140
-
141
-
142
-
143
-
144
-
145
-
146
-
147
-
148
-
149
-
150
-
151
-
152
-
153
-
154
-
155
-
156
-
157
-
158
-
159
-
160
-
161
-
162
-
163
-
164
-
165
-
166
-
167
-
168
-
169
-
170
-
171
-
172
-
173
-
174
-
175
-
176
-
177
-
178
-
179
-
180
-
181
-
182
-
183
-
184
-
185
-
186
-
187
-
188
-
189
-
190
-
191
-
192
-
193
-
194
-
195
-
196
-
197
-
198
-
199
-
200
-
201
-
202
-
203
-
204
-
205
-
206
-
207
-
208
-
209
-
210
-
211
-
212
-
213
-
214
-
215
-
216
-
217
-
218
 |
 |

allowance on these net operating loss carryforwards to nil and recorded a federal deferred tax benefit of £79.8
million. This change was due to a re-assessment of our intentions regarding certain assets during the
carryforward period and our judgment that it is more likely than not that these NOLs will be utilized prior to
expiry. Actual realization of these net operating loss carry forwards is dependent upon our ability to generate
taxable income from asset sales or operating activities prior to their expiration.
Loss from Continuing Operations
For the year ended December 31, 2010, loss from continuing operations decreased to £169.2 million from a
loss of £350.3 million for the same period in 2009 due to the factors discussed above.
Gain on disposal
For the year ended December 31, 2010, gain on disposal relating the sale of our Virgin Media TV business
was £19.2 million, net of tax of £15.0 million.
Income (Loss) on Discontinued Operations
For the year ended December 31, 2010, the income on discontinued operations was £27.8 million compared
with a loss of £7.5 million for the year ended December 31, 2009. The results of discontinued operations include
our former Virgin Media TV business sold in 2010 and former sit-up business sold in 2009.
The 2010 income on discontinued operations includes a £19.2 million gain on disposal of our former Virgin
Media TV business, net of tax of £15.0 million, and income of £8.6 million, net of tax, attributable to those
discontinued operations. No U.K. income tax is due as a result of the gain on disposal of Virgin Media TV due to
our ability to offset capital losses and capital allowances against this income. The tax expense associated with the
income on discontinued operations is offset with an equivalent tax benefit in continuing operations.
Basic Loss from Continuing Operations Per Share
Basic loss from continuing operations per common share for the year ended December 31, 2010 was £0.52
compared to £1.07 for the year ended December 31, 2009. Basic loss per share is computed using a weighted
average of 327.1 million shares issued and outstanding in the year ended December 31, 2010 and a weighted
average of 328.8 million shares issued and outstanding for the same period in 2009.
Segmental Results of Operations for the Years Ended December 31, 2010 and 2009
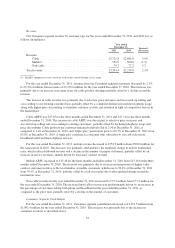
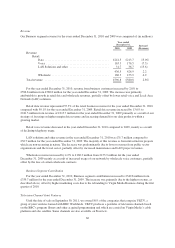
Consumer Segment
The summary combined results of operations of our Consumer segment for the years ended December 31,
2010 and 2009 were as follows (in millions):
Year ended
December 31, Increase/
(Decrease)2010 2009
Revenue ...................................................... £3,279.0 £3,083.1 6.4%
Segment contribution ........................................... 1,982.4 1,841.9 7.6
61