Virgin Media 2011 Annual Report Download - page 207
Download and view the complete annual report
Please find page 207 of the 2011 Virgin Media annual report below. You can navigate through the pages in the report by either clicking on the pages listed below, or by using the keyword search tool below to find specific information within the annual report.-
 1
1 -
2
-
3
-
4
-
5
-
6
-
7
-
8
-
9
-
10
-
11
-
12
-
13
-
14
-
15
-
16
-
17
-
18
-
19
-
20
-
21
-
22
-
23
-
24
-
25
-
26
-
27
-
28
-
29
-
30
-
31
-
32
-
33
-
34
-
35
-
36
-
37
-
38
-
39
-
40
-
41
-
42
-
43
-
44
-
45
-
46
-
47
-
48
-
49
-
50
-
51
-
52
-
53
-
54
-
55
-
56
-
57
-
58
-
59
-
60
-
61
-
62
-
63
-
64
-
65
-
66
-
67
-
68
-
69
-
70
-
71
-
72
-
73
-
74
-
75
-
76
-
77
-
78
-
79
-
80
-
81
-
82
-
83
-
84
-
85
-
86
-
87
-
88
-
89
-
90
-
91
-
92
-
93
-
94
-
95
-
96
-
97
-
98
-
99
-
100
-
101
-
102
-
103
-
104
-
105
-
106
-
107
-
108
-
109
-
110
-
111
-
112
-
113
-
114
-
115
-
116
-
117
-
118
-
119
-
120
-
121
-
122
-
123
-
124
-
125
-
126
-
127
-
128
-
129
-
130
-
131
-
132
-
133
-
134
-
135
-
136
-
137
-
138
-
139
-
140
-
141
-
142
-
143
-
144
-
145
-
146
-
147
-
148
-
149
-
150
-
151
-
152
-
153
-
154
-
155
-
156
-
157
-
158
-
159
-
160
-
161
-
162
-
163
-
164
-
165
-
166
-
167
-
168
-
169
-
170
-
171
-
172
-
173
-
174
-
175
-
176
-
177
-
178
-
179
-
180
-
181
-
182
-
183
-
184
-
185
-
186
-
187
-
188
-
189
-
190
-
191
-
192
-
193
-
194
-
195
-
196
-
 197
197 -
 198
198 -
 199
199 -
 200
200 -
 201
201 -
 202
202 -
 203
203 -
 204
204 -
 205
205 -
 206
206 -
 207
207 -
 208
208 -
 209
209 -
 210
210 -
 211
211 -
 212
212 -
 213
213 -
 214
214 -
 215
215 -
 216
216 -
 217
217 -
218
 |
 |

VIRGIN MEDIA INVESTMENT HOLDINGS LIMITED AND SUBSIDIARIES
VIRGIN MEDIA INVESTMENTS LIMITED AND SUBSIDIARIES
COMBINED NOTES TO THE CONSOLIDATED FINANCIAL STATEMENTS (continued)
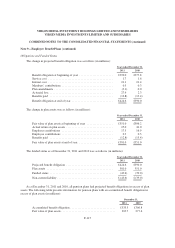
Note 9—Employee Benefit Plans (continued)
December 31, 2010
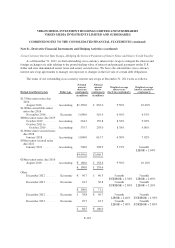
Fair value hierarchy
Asset category Level 1 Level 2 Level 3 Total
Equity Securities ................................................ £141.3 £ 0.0 £0.0 £141.3
Government Bonds .............................................. 111.9 0.0 0.0 111.9
Corporate Bonds ................................................ 60.9 0.0 0.0 60.9
Real Estate ..................................................... 4.5 0.7 0.0 5.2
Hedge Funds ................................................... 0.0 28.5 0.0 28.5
Cash .......................................................... 3.2 0.0 0.0 3.2
Total .......................................................... £321.8 £29.2 £0.0 £351.0
The substantial majority of plan assets are valued using quoted prices for the holding.
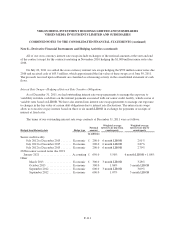
The trustees of the main defined benefit pension plan, which makes up approximately 80% of the assets of
our two defined benefit pension plans, have in place an investment strategy that targets an allocation of 40%
equities, 10% fund of hedge funds, 3% property and 47% bonds and cash, at December 31, 2011. The assets are
managed by a number of fund managers, which means as markets move relative to each other the assets move
away from the target investment strategy. Relatively small deviations from the target investment strategy are
permitted; however, rebalancing of the assets will be carried out from time to time. As the main defined benefit
pension scheme is now closed to new entrants, it is anticipated that the investment strategy will move towards a
higher proportion of bonds over time to reflect the steadily maturing profile of liabilities and the improvement in
the funding position.
There were no directly owned shares of our common stock included in the equity securities at December 31,
2011 or 2010.
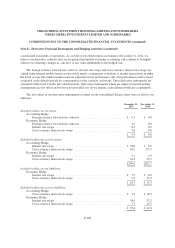
Estimated Future Benefit Payments
The benefits expected to be paid out of the pension plans in total are set out below for each of the next five
years and the following five years in aggregate. The benefits expected to be paid are based on the same
assumptions used to measure our benefit obligation at December 31, 2011 and include estimated future employee
services (in millions):
Year ending December 31:
Pension
Benefits
2012 .............................................................. £ 13.9
2013 .............................................................. 14.8
2014 .............................................................. 15.9
2015 .............................................................. 17.0
2016 .............................................................. 18.1
Years 2017-2021 .................................................... £111.9
F-118