Virgin Media 2011 Annual Report Download - page 63
Download and view the complete annual report
Please find page 63 of the 2011 Virgin Media annual report below. You can navigate through the pages in the report by either clicking on the pages listed below, or by using the keyword search tool below to find specific information within the annual report.-
 1
1 -
2
-
3
-
4
-
5
-
6
-
7
-
8
-
9
-
10
-
11
-
12
-
13
-
14
-
15
-
16
-
17
-
18
-
19
-
20
-
21
-
22
-
23
-
24
-
25
-
26
-
27
-
28
-
29
-
30
-
31
-
32
-
33
-
34
-
35
-
36
-
37
-
38
-
39
-
40
-
41
-
42
-
43
-
44
-
45
-
46
-
47
-
48
-
49
-
50
-
51
-
52
-
 53
53 -
 54
54 -
 55
55 -
 56
56 -
 57
57 -
 58
58 -
 59
59 -
 60
60 -
 61
61 -
 62
62 -
 63
63 -
 64
64 -
 65
65 -
 66
66 -
 67
67 -
 68
68 -
 69
69 -
 70
70 -
 71
71 -
 72
72 -
 73
73 -
74
-
75
-
76
-
77
-
78
-
79
-
80
-
81
-
82
-
83
-
84
-
85
-
86
-
87
-
88
-
89
-
90
-
91
-
92
-
93
-
94
-
95
-
96
-
97
-
98
-
99
-
100
-
101
-
102
-
103
-
104
-
105
-
106
-
107
-
108
-
109
-
110
-
111
-
112
-
113
-
114
-
115
-
116
-
117
-
118
-
119
-
120
-
121
-
122
-
123
-
124
-
125
-
126
-
127
-
128
-
129
-
130
-
131
-
132
-
133
-
134
-
135
-
136
-
137
-
138
-
139
-
140
-
141
-
142
-
143
-
144
-
145
-
146
-
147
-
148
-
149
-
150
-
151
-
152
-
153
-
154
-
155
-
156
-
157
-
158
-
159
-
160
-
161
-
162
-
163
-
164
-
165
-
166
-
167
-
168
-
169
-
170
-
171
-
172
-
173
-
174
-
175
-
176
-
177
-
178
-
179
-
180
-
181
-
182
-
183
-
184
-
185
-
186
-
187
-
188
-
189
-
190
-
191
-
192
-
193
-
194
-
195
-
196
-
197
-
198
-
199
-
200
-
201
-
202
-
203
-
204
-
205
-
206
-
207
-
208
-
209
-
210
-
211
-
212
-
213
-
214
-
215
-
216
-
217
-
218
 |
 |

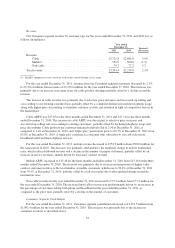
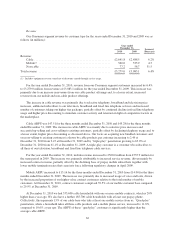
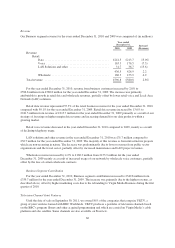
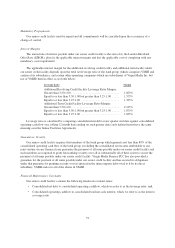
Revenue
Our Consumer segment revenue by customer type for the years ended December 31, 2010 and 2009 was as
follows (in millions):
Year ended
December 31, Increase/
(Decrease)2010 2009
Revenue:
Cable .................................................... £2,641.8 £2,488.5 6.2%
Mobile(1) ................................................. 560.0 535.9 4.5
Non-cable ................................................ 77.2 58.7 31.5
Total revenue ................................................. £3,279.0 £3,083.1 6.4%
(1) Includes equipment revenue stated net of discounts earned through service usage.
For the year ended December 31, 2010, revenue from our Consumer segment customers increased by 6.4%
to £3,279.0 million from revenue of £3,083.1 million for the year ended December 31, 2009. This increase was
primarily due to an increase in revenues from our cable product offerings and, to a lesser extent, increased
revenue from our mobile and non-cable product offerings.
The increase in cable revenue was primarily due to selective telephony, broadband and television price
increases, additional subscribers to our television, broadband and fixed line telephone services and increased
number of customers taking our higher tier packages, partially offset by continued decline in fixed line telephony
usage and higher price discounting to stimulate customer activity and retention in light of competitive factors in
the marketplace.
Cable ARPU was £47.51 for the three months ended December 31, 2010 and £45.28 for the three months
ended December 31, 2009. The increase in cable ARPU was mainly due to selective price increases and
successful up-selling and cross-selling to existing customers, partially offset by declining telephony usage and, to
a lesser extent, higher price discounting as discussed above. Our focus on acquiring new bundled customers and
on cross-selling to existing customers is shown by cable products per customer increasing to 2.49 at
December 31, 2010 from 2.47 at December 31, 2009 and by “triple-play” penetration growing to 63.0% at
December 31, 2010 from 61.1% at December 31, 2009. A triple-play customer is a customer who subscribes to
all three of our television, broadband and fixed line telephone cable services.
For the year ended December 31, 2010, mobile revenue increased to £560.0 million from £535.9 million for
the same period in 2009. The increase was primarily attributable to increased service revenue, driven mainly by
increased contract revenue, partially offset by the declining base of prepay mobile subscribers together with
lower mobile termination rates that came into force following regulatory changes in April 2009.
Mobile ARPU increased to £15.16 for the three months ended December 31, 2010 from £14.00 for the three
months ended December 31, 2009. The increase was primarily due to increased usage of voice and texts, driven
by the increased proportion of our higher value contract customers relative to the total number of mobile
customers. At December 31, 2010, contract customers comprised 39.5% of our mobile customer base compared
to 29.9% at December 31, 2009.
At December 31, 2010 we had 535,600 cable households with one or more mobile contracts, which is 20%
higher than a year ago. We also have a further 185,700 cable households with at least one prepay phone.
Collectively, this represents 15% of our cable base who take at least one mobile service from us. “Quad-play”
penetration, where a household takes all three cable products and a mobile phone service, increased to 11.8%,
compared to 10.6% a year ago. The ARPU of these “quad-play” customers is significantly higher than the
average cable ARPU.
62