Virgin Media 2011 Annual Report Download - page 117
Download and view the complete annual report
Please find page 117 of the 2011 Virgin Media annual report below. You can navigate through the pages in the report by either clicking on the pages listed below, or by using the keyword search tool below to find specific information within the annual report.-
 1
1 -
2
-
3
-
4
-
5
-
6
-
7
-
8
-
9
-
10
-
11
-
12
-
13
-
14
-
15
-
16
-
17
-
18
-
19
-
20
-
21
-
22
-
23
-
24
-
25
-
26
-
27
-
28
-
29
-
30
-
31
-
32
-
33
-
34
-
35
-
36
-
37
-
38
-
39
-
40
-
41
-
42
-
43
-
44
-
45
-
46
-
47
-
48
-
49
-
50
-
51
-
52
-
53
-
54
-
55
-
56
-
57
-
58
-
59
-
60
-
61
-
62
-
63
-
64
-
65
-
66
-
67
-
68
-
69
-
70
-
71
-
72
-
73
-
74
-
75
-
76
-
77
-
78
-
79
-
80
-
81
-
82
-
83
-
84
-
85
-
86
-
87
-
88
-
89
-
90
-
91
-
92
-
93
-
94
-
95
-
96
-
97
-
98
-
99
-
100
-
101
-
102
-
103
-
104
-
105
-
106
-
 107
107 -
 108
108 -
 109
109 -
 110
110 -
 111
111 -
 112
112 -
 113
113 -
 114
114 -
 115
115 -
 116
116 -
 117
117 -
 118
118 -
 119
119 -
 120
120 -
 121
121 -
 122
122 -
 123
123 -
 124
124 -
 125
125 -
 126
126 -
 127
127 -
128
-
129
-
130
-
131
-
132
-
133
-
134
-
135
-
136
-
137
-
138
-
139
-
140
-
141
-
142
-
143
-
144
-
145
-
146
-
147
-
148
-
149
-
150
-
151
-
152
-
153
-
154
-
155
-
156
-
157
-
158
-
159
-
160
-
161
-
162
-
163
-
164
-
165
-
166
-
167
-
168
-
169
-
170
-
171
-
172
-
173
-
174
-
175
-
176
-
177
-
178
-
179
-
180
-
181
-
182
-
183
-
184
-
185
-
186
-
187
-
188
-
189
-
190
-
191
-
192
-
193
-
194
-
195
-
196
-
197
-
198
-
199
-
200
-
201
-
202
-
203
-
204
-
205
-
206
-
207
-
208
-
209
-
210
-
211
-
212
-
213
-
214
-
215
-
216
-
217
-
218
 |
 |

VIRGIN MEDIA INC. AND SUBSIDIARIES
NOTES TO CONSOLIDATED FINANCIAL STATEMENTS (continued)
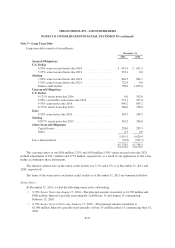
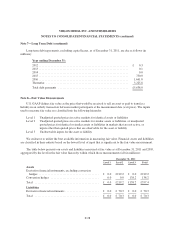
Note 7—Long Term Debt (continued)
Long term debt repayments, excluding capital leases, as of December 31, 2011, are due as follows (in
millions):
Year ending December 31:
2012 ............................................................. £ 0.3
2013 ............................................................. 0.1
2014 ............................................................. 0.0
2015 ............................................................. 750.0
2016 ............................................................. 1,661.8
Thereafter ........................................................ 3,225.8
Total debt payments ................................................ £5,638.0
Note 8—Fair Value Measurements
U.S. GAAP defines fair value as the price that would be received to sell an asset or paid to transfer a
liability in an orderly transaction between market participants at the measurement date (exit price). The inputs
used to measure fair value are classified into the following hierarchy:
Level 1 Unadjusted quoted prices in active markets for identical assets or liabilities
Level 2 Unadjusted quoted prices in active markets for similar assets or liabilities, or unadjusted
quoted prices for identical or similar assets or liabilities in markets that are not active, or
inputs other than quoted prices that are observable for the asset or liability
Level 3 Unobservable inputs for the asset or liability
We endeavor to utilize the best available information in measuring fair value. Financial assets and liabilities
are classified in their entirety based on the lowest level of input that is significant to the fair value measurement.
The table below presents our assets and liabilities measured at fair value as at December 31, 2011 and 2010,
aggregated by the level in the fair value hierarchy within which those measurements fall (in millions):
December 31, 2011
Level 1 Level 2 Level 3 Total
Assets
Derivative financial instruments, excluding conversion
hedges ......................................... £ 0.0 £219.2 £ 0.0 £219.2
Conversion hedges ................................. 0.0 0.0 138.2 138.2
Total ............................................ £ 0.0 £219.2 £138.2 £357.4
Liabilities
Derivative financial instruments ....................... £ 0.0 £ 70.3 £ 0.0 £ 70.3
Total ............................................ £ 0.0 £ 70.3 £ 0.0 £ 70.3
F-28