Virgin Media 2011 Annual Report Download - page 130
Download and view the complete annual report
Please find page 130 of the 2011 Virgin Media annual report below. You can navigate through the pages in the report by either clicking on the pages listed below, or by using the keyword search tool below to find specific information within the annual report.-
 1
1 -
2
-
3
-
4
-
5
-
6
-
7
-
8
-
9
-
10
-
11
-
12
-
13
-
14
-
15
-
16
-
17
-
18
-
19
-
20
-
21
-
22
-
23
-
24
-
25
-
26
-
27
-
28
-
29
-
30
-
31
-
32
-
33
-
34
-
35
-
36
-
37
-
38
-
39
-
40
-
41
-
42
-
43
-
44
-
45
-
46
-
47
-
48
-
49
-
50
-
51
-
52
-
53
-
54
-
55
-
56
-
57
-
58
-
59
-
60
-
61
-
62
-
63
-
64
-
65
-
66
-
67
-
68
-
69
-
70
-
71
-
72
-
73
-
74
-
75
-
76
-
77
-
78
-
79
-
80
-
81
-
82
-
83
-
84
-
85
-
86
-
87
-
88
-
89
-
90
-
91
-
92
-
93
-
94
-
95
-
96
-
97
-
98
-
99
-
100
-
101
-
102
-
103
-
104
-
105
-
106
-
107
-
108
-
109
-
110
-
111
-
112
-
113
-
114
-
115
-
116
-
117
-
118
-
119
-
 120
120 -
 121
121 -
 122
122 -
 123
123 -
 124
124 -
 125
125 -
 126
126 -
 127
127 -
 128
128 -
 129
129 -
 130
130 -
 131
131 -
 132
132 -
 133
133 -
 134
134 -
 135
135 -
 136
136 -
 137
137 -
 138
138 -
 139
139 -
 140
140 -
141
-
142
-
143
-
144
-
145
-
146
-
147
-
148
-
149
-
150
-
151
-
152
-
153
-
154
-
155
-
156
-
157
-
158
-
159
-
160
-
161
-
162
-
163
-
164
-
165
-
166
-
167
-
168
-
169
-
170
-
171
-
172
-
173
-
174
-
175
-
176
-
177
-
178
-
179
-
180
-
181
-
182
-
183
-
184
-
185
-
186
-
187
-
188
-
189
-
190
-
191
-
192
-
193
-
194
-
195
-
196
-
197
-
198
-
199
-
200
-
201
-
202
-
203
-
204
-
205
-
206
-
207
-
208
-
209
-
210
-
211
-
212
-
213
-
214
-
215
-
216
-
217
-
218
 |
 |

VIRGIN MEDIA INC. AND SUBSIDIARIES
NOTES TO CONSOLIDATED FINANCIAL STATEMENTS (continued)
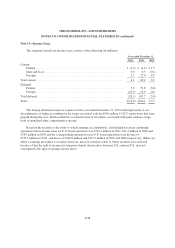
Note 10—Stock-Based Compensation Plans (continued)
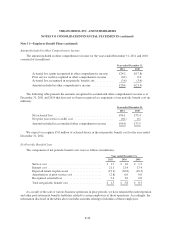
As of December 31, 2011, there was £0.2 million of total unrecognized compensation cost related to
non-vested shares of restricted stock granted for which a measurement date has been established. That cost is
expected to be recognized over a weighted-average period of 0.8 years.
For performance based restricted stock grants, the performance objectives are set by the Compensation
Committee of the Board of Directors based upon quantitative and qualitative objectives, including earnings,
operational performance and achievement of strategic goals, amongst others. These objectives may be absolute or
relative to prior performance or to the performance of other entities, indices or benchmarks and may be expressed
in terms of progression within a specific range.
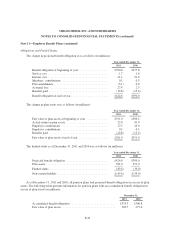
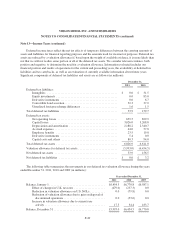
The total fair value of shares of restricted stock vested during the years ended December 31, 2011, 2010 and
2009, was £5.1 million, £7.0 million and £0.4 million, respectively.
Restricted Stock Unit and Performance Share Grants
Participants in the our long term incentive plans are awarded restricted stock units or performance shares
which vest after a three year period dependent on the achievement of certain long term performance targets and
continued employment. The final number of awards vesting will be settled, at the Compensation Committee’s
discretion, in either common stock or an amount of cash equivalent to the fair market value at the date of vesting.
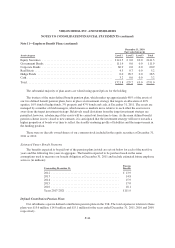
In 2010, the Compensation Committee introduced a relative stock performance measure to our stock
incentive plan. The vesting of a proportion of restricted stock units under the 2010-2012 and 2011-2013 long
term incentive plans are subject to a relative Total Shareholder Value (“TSV”) performance measure. The
measure is based on a comparison of our stock price growth with that of a comparator group of organizations
selected by the Compensation Committee. The fair value of our restricted stock units containing a market
condition, granted under our 2010-2012 and 2011-2013 long term incentive plans were estimated at the date of
grant using the Monte Carlo simulation model.
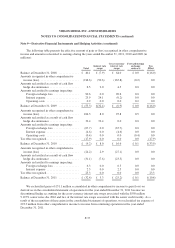
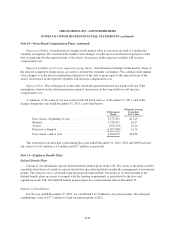
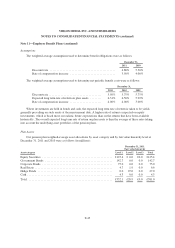
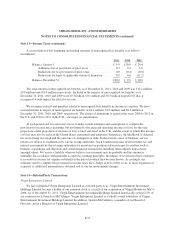
The following assumptions were used to measure the fair value of the proportion of restricted stock units
subject to the TSV performance measure as of the grant date.
Year ended
December 31, 2011
Risk-free Interest Rate ................................. 0.926% - 2.542%
Expected Dividend Yield .............................. 0.64%
Expected Volatility of Virgin Media Shares ................ 69.58%
Expected Volatility of Selected Comparator Group Shares .... 25.85% - 59.67%
Expected Lives ...................................... 2.926 Years
Risk-free interest rates. This is the range of domestic risk free rates representing the principle markets in
which our stock and the stocks of the comparator group organizations trade. An increase in the risk-free rates will
increase compensation cost.
Expected dividend yield. This is the annual rate of dividends per share over the stock price on the grant date.
An increase in the dividend yield will increase compensation cost.
F-41