Virgin Media 2011 Annual Report Download - page 181
Download and view the complete annual report
Please find page 181 of the 2011 Virgin Media annual report below. You can navigate through the pages in the report by either clicking on the pages listed below, or by using the keyword search tool below to find specific information within the annual report.-
 1
1 -
2
-
3
-
4
-
5
-
6
-
7
-
8
-
9
-
10
-
11
-
12
-
13
-
14
-
15
-
16
-
17
-
18
-
19
-
20
-
21
-
22
-
23
-
24
-
25
-
26
-
27
-
28
-
29
-
30
-
31
-
32
-
33
-
34
-
35
-
36
-
37
-
38
-
39
-
40
-
41
-
42
-
43
-
44
-
45
-
46
-
47
-
48
-
49
-
50
-
51
-
52
-
53
-
54
-
55
-
56
-
57
-
58
-
59
-
60
-
61
-
62
-
63
-
64
-
65
-
66
-
67
-
68
-
69
-
70
-
71
-
72
-
73
-
74
-
75
-
76
-
77
-
78
-
79
-
80
-
81
-
82
-
83
-
84
-
85
-
86
-
87
-
88
-
89
-
90
-
91
-
92
-
93
-
94
-
95
-
96
-
97
-
98
-
99
-
100
-
101
-
102
-
103
-
104
-
105
-
106
-
107
-
108
-
109
-
110
-
111
-
112
-
113
-
114
-
115
-
116
-
117
-
118
-
119
-
120
-
121
-
122
-
123
-
124
-
125
-
126
-
127
-
128
-
129
-
130
-
131
-
132
-
133
-
134
-
135
-
136
-
137
-
138
-
139
-
140
-
141
-
142
-
143
-
144
-
145
-
146
-
147
-
148
-
149
-
150
-
151
-
152
-
153
-
154
-
155
-
156
-
157
-
158
-
159
-
160
-
161
-
162
-
163
-
164
-
165
-
166
-
167
-
168
-
169
-
170
-
 171
171 -
 172
172 -
 173
173 -
 174
174 -
 175
175 -
 176
176 -
 177
177 -
 178
178 -
 179
179 -
 180
180 -
 181
181 -
 182
182 -
 183
183 -
 184
184 -
 185
185 -
 186
186 -
 187
187 -
 188
188 -
 189
189 -
 190
190 -
 191
191 -
192
-
193
-
194
-
195
-
196
-
197
-
198
-
199
-
200
-
201
-
202
-
203
-
204
-
205
-
206
-
207
-
208
-
209
-
210
-
211
-
212
-
213
-
214
-
215
-
216
-
217
-
218
 |
 |

VIRGIN MEDIA INVESTMENT HOLDINGS LIMITED AND SUBSIDIARIES
VIRGIN MEDIA INVESTMENTS LIMITED AND SUBSIDIARIES
COMBINED NOTES TO THE CONSOLIDATED FINANCIAL STATEMENTS (continued)
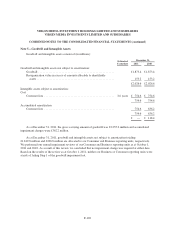
Note 2—Significant Accounting Policies (continued)
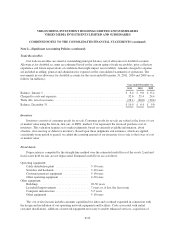
Trade Receivables
Our trade receivables are stated at outstanding principal balance, net of allowance for doubtful accounts.
Allowances for doubtful accounts are estimated based on the current aging of trade receivables, prior collection
experience and future expectations of conditions that might impact recoverability. Amounts charged to expense
are included in selling, general and administrative expenses in the consolidated statements of operations. The
movements in our allowance for doubtful accounts for the years ended December 31, 2011, 2010 and 2009 are as
follows (in millions):
Year ended December 31,
2011 2010 2009
Balance, January 1 ...................................................... £ 6.4 £ 9.0 £15.2
Charged to costs and expenses ............................................. 32.6 25.4 24.4
Write offs, net of recoveries ............................................... (28.1) (28.0) (30.6)
Balance, December 31 ................................................... £10.9 £ 6.4 £ 9.0
Inventory
Inventory consists of consumer goods for re-sale. Consumer goods for re-sale are valued at the lower of cost
or market value using the first-in, first-out, or FIFO, method. Cost represents the invoiced purchase cost of
inventory. This valuation requires us to make judgments, based on currently available information, about
obsolete, slow-moving or defective inventory. Based upon these judgments and estimates, which are applied
consistently from period to period, we adjust the carrying amount of our inventory for re-sale to the lower of cost
or market value.
Fixed Assets
Depreciation is computed by the straight-line method over the estimated useful lives of the assets. Land and
fixed assets held for sale are not depreciated. Estimated useful lives are as follows:
Operating equipment:
Cable distribution plant ...................... 5-30 years
Switches and headends ....................... 3-10 years
Customer premises equipment ................. 5-10 years
Other operating equipment .................... 4-20 years
Other equipment:
Buildings ................................. 20-50 years
Leasehold improvements ..................... 7years or, if less, the lease term
Computer infrastructure ...................... 3-5years
Other equipment ............................ 5-10 years
The cost of fixed assets includes amounts capitalized for labor and overhead expended in connection with
the design and installation of our operating network equipment and facilities. Costs associated with initial
customer installations, additions of network equipment necessary to enable enhanced services, acquisition of
F-92