Virgin Media 2011 Annual Report Download - page 52
Download and view the complete annual report
Please find page 52 of the 2011 Virgin Media annual report below. You can navigate through the pages in the report by either clicking on the pages listed below, or by using the keyword search tool below to find specific information within the annual report.-
 1
1 -
2
-
3
-
4
-
5
-
6
-
7
-
8
-
9
-
10
-
11
-
12
-
13
-
14
-
15
-
16
-
17
-
18
-
19
-
20
-
21
-
22
-
23
-
24
-
25
-
26
-
27
-
28
-
29
-
30
-
31
-
32
-
33
-
34
-
35
-
36
-
37
-
38
-
39
-
40
-
41
-
 42
42 -
 43
43 -
 44
44 -
 45
45 -
 46
46 -
 47
47 -
 48
48 -
 49
49 -
 50
50 -
 51
51 -
 52
52 -
 53
53 -
 54
54 -
 55
55 -
 56
56 -
 57
57 -
 58
58 -
 59
59 -
 60
60 -
 61
61 -
 62
62 -
63
-
64
-
65
-
66
-
67
-
68
-
69
-
70
-
71
-
72
-
73
-
74
-
75
-
76
-
77
-
78
-
79
-
80
-
81
-
82
-
83
-
84
-
85
-
86
-
87
-
88
-
89
-
90
-
91
-
92
-
93
-
94
-
95
-
96
-
97
-
98
-
99
-
100
-
101
-
102
-
103
-
104
-
105
-
106
-
107
-
108
-
109
-
110
-
111
-
112
-
113
-
114
-
115
-
116
-
117
-
118
-
119
-
120
-
121
-
122
-
123
-
124
-
125
-
126
-
127
-
128
-
129
-
130
-
131
-
132
-
133
-
134
-
135
-
136
-
137
-
138
-
139
-
140
-
141
-
142
-
143
-
144
-
145
-
146
-
147
-
148
-
149
-
150
-
151
-
152
-
153
-
154
-
155
-
156
-
157
-
158
-
159
-
160
-
161
-
162
-
163
-
164
-
165
-
166
-
167
-
168
-
169
-
170
-
171
-
172
-
173
-
174
-
175
-
176
-
177
-
178
-
179
-
180
-
181
-
182
-
183
-
184
-
185
-
186
-
187
-
188
-
189
-
190
-
191
-
192
-
193
-
194
-
195
-
196
-
197
-
198
-
199
-
200
-
201
-
202
-
203
-
204
-
205
-
206
-
207
-
208
-
209
-
210
-
211
-
212
-
213
-
214
-
215
-
216
-
217
-
218
 |
 |

(Loss) Income on Discontinued Operations
For the year ended December 31, 2011, the loss on discontinued operations was £1.2 million compared with
an income of £27.8 million for the year ended December 31, 2010. The results of discontinued operations are
comprised of our former Virgin Media TV business sold in 2010.
The 2010 income on discontinued operations includes a £19.2 million gain on disposal of our former Virgin
Media TV business, net of tax of £15.0 million, and income of £8.6 million, net of tax, attributable to those
discontinued operations. No U.K. income tax is due as a result of the gain on disposal of Virgin Media TV due to
our ability to offset capital losses and capital allowances against this income. The tax expense associated with the
income on discontinued operations is offset with an equivalent tax benefit in continuing operations.
Basic Income (Loss) from Continuing Operations Per Share
Basic income from continuing operations per common share for the year ended December 31, 2011 was
£0.25 compared to a basic loss per share of £0.52 for the year ended December 31, 2010. Basic income (loss) per
share is computed using a weighted average of 310.1 million shares issued and outstanding in the year ended
December 31, 2011 and a weighted average of 327.1 million shares issued and outstanding for the same period in
2010.
Contingent Losses
Our VAT treatment of certain other revenue generating activities remains subject to challenge by the U.K.
tax authorities. As a result, we have estimated contingent losses totaling £27.4 million as of December 31, 2011
that are not accrued for, as we deem them to be reasonably possible, but not probable, of resulting in a liability.
We currently expect an initial hearing on these matters to take place in 2012.
Segmental Results of Operations for the Years Ended December 31, 2011 and 2010
A description of the products and services, as well as financial data, for each segment can be found in
note 17 to the consolidated financial statements of Virgin Media Inc. The reportable segments disclosed in this
document are based on our management organizational structure as of December 31, 2011.
Segment contribution, which is operating income (loss) before network operating costs, corporate costs,
depreciation, amortization, goodwill and intangible asset impairments and restructuring and other charges, is
management’s measure of segment profit. Segment contribution excludes the impact of certain costs and
expenses that are not directly attributable to the reporting segments, such as the costs of operating the network,
corporate costs, depreciation and amortization. Restructuring and other charges, and goodwill and intangible
asset impairments, are excluded from segment contribution as management believes they are not characteristic of
our underlying business operations. Assets are reviewed on a consolidated basis and are not allocated to segments
for management reporting since the primary asset of the business is the cable network infrastructure which is
shared by our Consumer and Business segments.
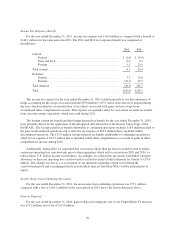
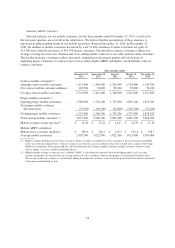
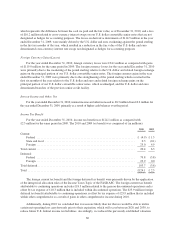
Consumer Segment
The summary combined results of operations of our Consumer segment for the years ended December 31,
2011 and 2010 were as follows (in millions):
Year ended
December 31, Increase/
(Decrease)2011 2010
Revenue .............................................. £3,354.4 £3,279.0 2.3%
Segment contribution ................................... 1,991.5 1,982.4 0.5
51