Virgin Media 2011 Annual Report Download - page 41
Download and view the complete annual report
Please find page 41 of the 2011 Virgin Media annual report below. You can navigate through the pages in the report by either clicking on the pages listed below, or by using the keyword search tool below to find specific information within the annual report.-
 1
1 -
2
-
3
-
4
-
5
-
6
-
7
-
8
-
9
-
10
-
11
-
12
-
13
-
14
-
15
-
16
-
17
-
18
-
19
-
20
-
21
-
22
-
23
-
24
-
25
-
26
-
27
-
28
-
29
-
30
-
 31
31 -
 32
32 -
 33
33 -
 34
34 -
 35
35 -
 36
36 -
 37
37 -
 38
38 -
 39
39 -
 40
40 -
 41
41 -
 42
42 -
 43
43 -
 44
44 -
 45
45 -
 46
46 -
 47
47 -
 48
48 -
 49
49 -
 50
50 -
 51
51 -
52
-
53
-
54
-
55
-
56
-
57
-
58
-
59
-
60
-
61
-
62
-
63
-
64
-
65
-
66
-
67
-
68
-
69
-
70
-
71
-
72
-
73
-
74
-
75
-
76
-
77
-
78
-
79
-
80
-
81
-
82
-
83
-
84
-
85
-
86
-
87
-
88
-
89
-
90
-
91
-
92
-
93
-
94
-
95
-
96
-
97
-
98
-
99
-
100
-
101
-
102
-
103
-
104
-
105
-
106
-
107
-
108
-
109
-
110
-
111
-
112
-
113
-
114
-
115
-
116
-
117
-
118
-
119
-
120
-
121
-
122
-
123
-
124
-
125
-
126
-
127
-
128
-
129
-
130
-
131
-
132
-
133
-
134
-
135
-
136
-
137
-
138
-
139
-
140
-
141
-
142
-
143
-
144
-
145
-
146
-
147
-
148
-
149
-
150
-
151
-
152
-
153
-
154
-
155
-
156
-
157
-
158
-
159
-
160
-
161
-
162
-
163
-
164
-
165
-
166
-
167
-
168
-
169
-
170
-
171
-
172
-
173
-
174
-
175
-
176
-
177
-
178
-
179
-
180
-
181
-
182
-
183
-
184
-
185
-
186
-
187
-
188
-
189
-
190
-
191
-
192
-
193
-
194
-
195
-
196
-
197
-
198
-
199
-
200
-
201
-
202
-
203
-
204
-
205
-
206
-
207
-
208
-
209
-
210
-
211
-
212
-
213
-
214
-
215
-
216
-
217
-
218
 |
 |

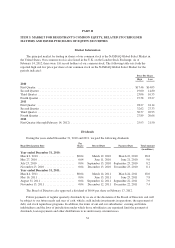
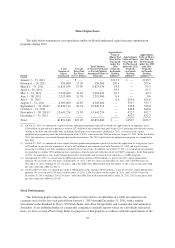
under the 2011 capital structure optimization program consisting of approximately 5.1 million shares under open
market repurchases at an average purchase price per share of $24.86 ($127.0 million in aggregate) and
approximately 23.8 million shares under capped accelerated stock repurchase programs at an average purchase
price per share of $23.15 ($550 million in aggregate). The capped accelerated stock repurchase programs under
the 2011 capital structure optimization program were completed by entering into an agreement with a
counterparty on September 8, 2011 to effect a $250.0 million (£156.6 million) capped accelerated stock
repurchase program under which we received approximately 10.1 million shares of our common stock at an
average purchase price per share of $24.71, and by entering into another agreement with the same counterparty
on November 10, 2011 to effect a further $300.0 million (£188.0 million) capped accelerated stock repurchase
program under which we received approximately 13.6 million shares of our common stock at an average
purchase price per share of $21.99.
During the year ended December 31, 2010, we repurchased 11.6 million shares of common stock in
connection with the 2010 capital structure optimization program, at an average purchase price per share of
$21.98 ($255.7 million in aggregate) through an accelerated stock repurchase program and open market
repurchases. The shares of common stock acquired in connection with the 2010 capital structure optimization
program were cancelled.
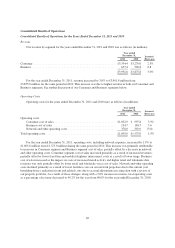
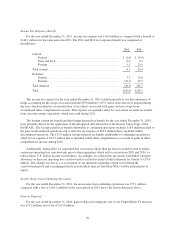
Revenue
Our revenue by segment for the years ended December 31, 2011, 2010 and 2009 was as follows
(in millions):
Year ended December 31,
2011 2010 2009
Consumer .................................. £3,354.4 84.0% £3,279.0 84.6% £3,083.1 84.1%
Business ................................... 637.4 16.0 596.8 15.4 580.8 15.9
£3,991.8 100.0% £3,875.8 100.0% £3,663.9 100.0%
The principal sources of revenue within each segment are:
Consumer
• monthly fees and usage charges for cable and non-cable telephone and internet access services and
cable television services;
• monthly fees and usage charges for mobile services including charges for airtime, data, long-distance
calls and roaming;
• installation and connection services; and
• charges for the supply of mobile handset and other equipment.
Business
• monthly fees and usage charges for inbound and outbound voice, data and internet services and charges
for transmission, fiber and voice services provided to retail and wholesale customers; and
• installation and connection services.
40