Virgin Media 2011 Annual Report Download - page 138
Download and view the complete annual report
Please find page 138 of the 2011 Virgin Media annual report below. You can navigate through the pages in the report by either clicking on the pages listed below, or by using the keyword search tool below to find specific information within the annual report.-
 1
1 -
2
-
3
-
4
-
5
-
6
-
7
-
8
-
9
-
10
-
11
-
12
-
13
-
14
-
15
-
16
-
17
-
18
-
19
-
20
-
21
-
22
-
23
-
24
-
25
-
26
-
27
-
28
-
29
-
30
-
31
-
32
-
33
-
34
-
35
-
36
-
37
-
38
-
39
-
40
-
41
-
42
-
43
-
44
-
45
-
46
-
47
-
48
-
49
-
50
-
51
-
52
-
53
-
54
-
55
-
56
-
57
-
58
-
59
-
60
-
61
-
62
-
63
-
64
-
65
-
66
-
67
-
68
-
69
-
70
-
71
-
72
-
73
-
74
-
75
-
76
-
77
-
78
-
79
-
80
-
81
-
82
-
83
-
84
-
85
-
86
-
87
-
88
-
89
-
90
-
91
-
92
-
93
-
94
-
95
-
96
-
97
-
98
-
99
-
100
-
101
-
102
-
103
-
104
-
105
-
106
-
107
-
108
-
109
-
110
-
111
-
112
-
113
-
114
-
115
-
116
-
117
-
118
-
119
-
120
-
121
-
122
-
123
-
124
-
125
-
126
-
127
-
 128
128 -
 129
129 -
 130
130 -
 131
131 -
 132
132 -
 133
133 -
 134
134 -
 135
135 -
 136
136 -
 137
137 -
 138
138 -
 139
139 -
 140
140 -
 141
141 -
 142
142 -
 143
143 -
 144
144 -
 145
145 -
 146
146 -
 147
147 -
 148
148 -
149
-
150
-
151
-
152
-
153
-
154
-
155
-
156
-
157
-
158
-
159
-
160
-
161
-
162
-
163
-
164
-
165
-
166
-
167
-
168
-
169
-
170
-
171
-
172
-
173
-
174
-
175
-
176
-
177
-
178
-
179
-
180
-
181
-
182
-
183
-
184
-
185
-
186
-
187
-
188
-
189
-
190
-
191
-
192
-
193
-
194
-
195
-
196
-
197
-
198
-
199
-
200
-
201
-
202
-
203
-
204
-
205
-
206
-
207
-
208
-
209
-
210
-
211
-
212
-
213
-
214
-
215
-
216
-
217
-
218
 |
 |

VIRGIN MEDIA INC. AND SUBSIDIARIES
NOTES TO CONSOLIDATED FINANCIAL STATEMENTS (continued)
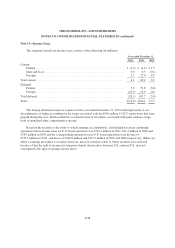
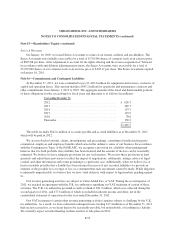
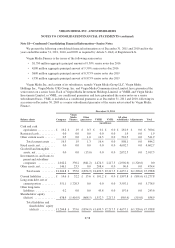
Note 13—Income Taxes (continued)
Deferred income taxes reflect the net tax effects of temporary differences between the carrying amounts of
assets and liabilities for financial reporting purposes and the amounts used for income tax purposes. Deferred tax
assets are reduced by a valuation allowance if, based upon the weight of available evidence, it is more likely than
not that we will not realize some portion or all of the deferred tax assets. We consider relevant evidence, both
positive and negative, to determine the need for a valuation allowance. Information evaluated includes our
financial position and results of operations for the current and preceeding years, the availability of deferred tax
liabilities and tax carrybacks, as well as an evaluation of currently available information about future years.
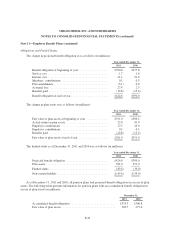
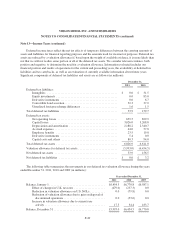
Significant components of deferred tax liabilities and assets are as follows (in millions):
December 31,
2011 2010
Deferred tax liabilities:
Intangibles ................................................ £ 0.0 £ 31.5
Equity investments .......................................... 0.0 83.0
Derivative instruments ....................................... 0.0 6.7
Convertible bond accretion .................................... 32.3 37.0
Unrealized foreign exchange differences ......................... 1.6 1.5
Total deferred tax liabilities ....................................... 33.9 159.7
Deferred tax assets:
Net operating losses ......................................... 659.5 829.9
Capital losses .............................................. 3,026.0 3,268.8
Depreciation and amortization ................................. 2,188.2 2,340.7
Accrued expenses ........................................... 44.0 57.8
Employee benefits .......................................... 23.5 19.8
Derivative instruments ....................................... 5.4 0.0
Capital costs and others ...................................... 80.3 94.0
Total deferred tax assets .......................................... 6,026.9 6,611.0
Valuation allowance for deferred tax assets ........................... (5,993.0) (6,454.5)
Net deferred tax assets ........................................... 33.9 156.5
Net deferred tax liabilities ........................................ £ 0.0 £ 3.2
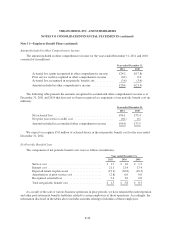
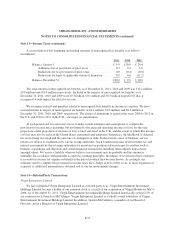
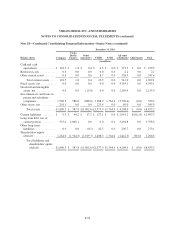
The following table summarizes the movements in our deferred tax valuation allowance during the years
ended December 31, 2011, 2010 and 2009 (in millions):
Year ended December 31,
2011 2010 2009
Balance, January 1 ...................................... £6,454.5 £6,770.8 £6,587.1
Effect of changes in U.K. tax rates ..................... (479.0) (237.3) 0.0
Reduction in valuation allowance on U.S. NOLs .......... 0.0 (79.8) 0.0
Reduction of valuation allowance due to gain on disposal of
discontinued operations ............................ 0.0 (33.6) 0.0
Increase in valuation allowance due to current year
activity ......................................... 17.5 34.4 183.7
Balance, December 31 ................................... £5,993.0 £6,454.5 £6,770.8
F-49