Virgin Media 2011 Annual Report Download - page 110
Download and view the complete annual report
Please find page 110 of the 2011 Virgin Media annual report below. You can navigate through the pages in the report by either clicking on the pages listed below, or by using the keyword search tool below to find specific information within the annual report.-
 1
1 -
2
-
3
-
4
-
5
-
6
-
7
-
8
-
9
-
10
-
11
-
12
-
13
-
14
-
15
-
16
-
17
-
18
-
19
-
20
-
21
-
22
-
23
-
24
-
25
-
26
-
27
-
28
-
29
-
30
-
31
-
32
-
33
-
34
-
35
-
36
-
37
-
38
-
39
-
40
-
41
-
42
-
43
-
44
-
45
-
46
-
47
-
48
-
49
-
50
-
51
-
52
-
53
-
54
-
55
-
56
-
57
-
58
-
59
-
60
-
61
-
62
-
63
-
64
-
65
-
66
-
67
-
68
-
69
-
70
-
71
-
72
-
73
-
74
-
75
-
76
-
77
-
78
-
79
-
80
-
81
-
82
-
83
-
84
-
85
-
86
-
87
-
88
-
89
-
90
-
91
-
92
-
93
-
94
-
95
-
96
-
97
-
98
-
99
-
 100
100 -
 101
101 -
 102
102 -
 103
103 -
 104
104 -
 105
105 -
 106
106 -
 107
107 -
 108
108 -
 109
109 -
 110
110 -
 111
111 -
 112
112 -
 113
113 -
 114
114 -
 115
115 -
 116
116 -
 117
117 -
 118
118 -
 119
119 -
 120
120 -
121
-
122
-
123
-
124
-
125
-
126
-
127
-
128
-
129
-
130
-
131
-
132
-
133
-
134
-
135
-
136
-
137
-
138
-
139
-
140
-
141
-
142
-
143
-
144
-
145
-
146
-
147
-
148
-
149
-
150
-
151
-
152
-
153
-
154
-
155
-
156
-
157
-
158
-
159
-
160
-
161
-
162
-
163
-
164
-
165
-
166
-
167
-
168
-
169
-
170
-
171
-
172
-
173
-
174
-
175
-
176
-
177
-
178
-
179
-
180
-
181
-
182
-
183
-
184
-
185
-
186
-
187
-
188
-
189
-
190
-
191
-
192
-
193
-
194
-
195
-
196
-
197
-
198
-
199
-
200
-
201
-
202
-
203
-
204
-
205
-
206
-
207
-
208
-
209
-
210
-
211
-
212
-
213
-
214
-
215
-
216
-
217
-
218
 |
 |

VIRGIN MEDIA INC. AND SUBSIDIARIES
NOTES TO CONSOLIDATED FINANCIAL STATEMENTS (continued)
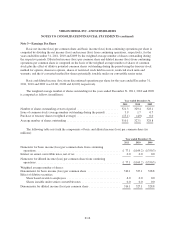
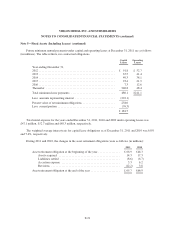
Note 5—Fixed Assets (Including Leases) (continued)
Future minimum annual payments under capital and operating leases at December 31, 2011 are as follows
(in millions). The table reflects our contractual obligations.
Capital
Leases
Operating
Leases
Year ending December 31,
2012 .................................................... £ 91.8 £ 52.7
2013 .................................................... 67.5 41.4
2014 .................................................... 49.3 34.1
2015 .................................................... 23.4 21.9
2016 .................................................... 7.3 12.6
Thereafter ............................................... 240.8 48.4
Total minimum lease payments .............................. 480.1 £211.1
Less: amounts representing interest ........................... (222.1)
Present value of net minimum obligations ...................... 258.0
Less: current portion ....................................... (76.3)
£ 181.7
Total rental expense for the years ended December 31, 2011, 2010 and 2009 under operating leases was
£47.1 million, £52.7 million and £48.3 million, respectively.
The weighted average interest rate for capital lease obligations as of December 31, 2011 and 2010 was 6.8%
and 7.4%, respectively.
During 2011 and 2010, the changes in the asset retirement obligations were as follows (in millions):
2011 2010
Asset retirement obligation at the beginning of the year ............... £66.9 £46.3
Assets acquired .......................................... 14.3 17.3
Liabilities settled ......................................... (8.6) (6.7)
Accretion expense ........................................ 5.3 6.2
Revisions ............................................... (12.2) 3.8
Asset retirement obligation at the end of the year .................... £65.7 £66.9
F-21