Virgin Media 2011 Annual Report Download - page 153
Download and view the complete annual report
Please find page 153 of the 2011 Virgin Media annual report below. You can navigate through the pages in the report by either clicking on the pages listed below, or by using the keyword search tool below to find specific information within the annual report.-
 1
1 -
2
-
3
-
4
-
5
-
6
-
7
-
8
-
9
-
10
-
11
-
12
-
13
-
14
-
15
-
16
-
17
-
18
-
19
-
20
-
21
-
22
-
23
-
24
-
25
-
26
-
27
-
28
-
29
-
30
-
31
-
32
-
33
-
34
-
35
-
36
-
37
-
38
-
39
-
40
-
41
-
42
-
43
-
44
-
45
-
46
-
47
-
48
-
49
-
50
-
51
-
52
-
53
-
54
-
55
-
56
-
57
-
58
-
59
-
60
-
61
-
62
-
63
-
64
-
65
-
66
-
67
-
68
-
69
-
70
-
71
-
72
-
73
-
74
-
75
-
76
-
77
-
78
-
79
-
80
-
81
-
82
-
83
-
84
-
85
-
86
-
87
-
88
-
89
-
90
-
91
-
92
-
93
-
94
-
95
-
96
-
97
-
98
-
99
-
100
-
101
-
102
-
103
-
104
-
105
-
106
-
107
-
108
-
109
-
110
-
111
-
112
-
113
-
114
-
115
-
116
-
117
-
118
-
119
-
120
-
121
-
122
-
123
-
124
-
125
-
126
-
127
-
128
-
129
-
130
-
131
-
132
-
133
-
134
-
135
-
136
-
137
-
138
-
139
-
140
-
141
-
142
-
 143
143 -
 144
144 -
 145
145 -
 146
146 -
 147
147 -
 148
148 -
 149
149 -
 150
150 -
 151
151 -
 152
152 -
 153
153 -
 154
154 -
 155
155 -
 156
156 -
 157
157 -
 158
158 -
 159
159 -
 160
160 -
 161
161 -
 162
162 -
 163
163 -
164
-
165
-
166
-
167
-
168
-
169
-
170
-
171
-
172
-
173
-
174
-
175
-
176
-
177
-
178
-
179
-
180
-
181
-
182
-
183
-
184
-
185
-
186
-
187
-
188
-
189
-
190
-
191
-
192
-
193
-
194
-
195
-
196
-
197
-
198
-
199
-
200
-
201
-
202
-
203
-
204
-
205
-
206
-
207
-
208
-
209
-
210
-
211
-
212
-
213
-
214
-
215
-
216
-
217
-
218
 |
 |

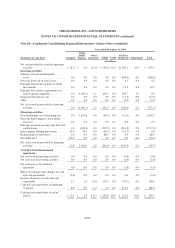
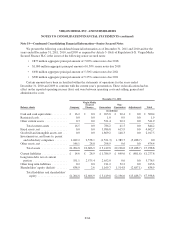
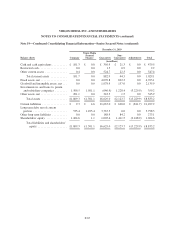
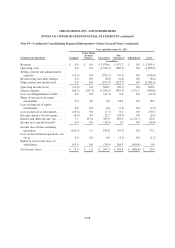
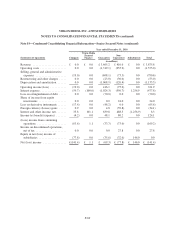
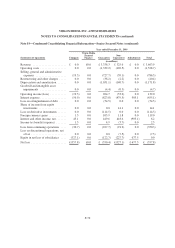
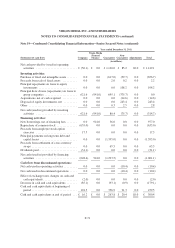
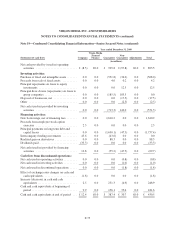
VIRGIN MEDIA INC. AND SUBSIDIARIES
NOTES TO CONSOLIDATED FINANCIAL STATEMENTS (continued)
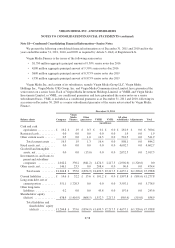
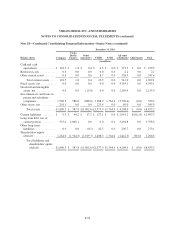
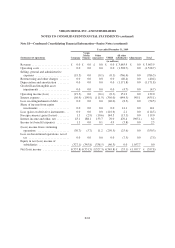
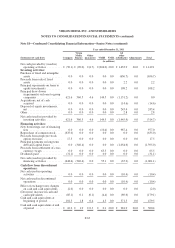
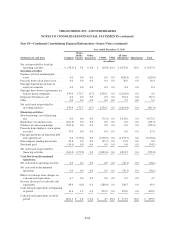
Note 18—Condensed Consolidating Financial Information—Senior Notes (continued)
Year ended December 31, 2010
Statements of cash flows Company
Virgin
Media
Finance
Other
guarantors VMIH VMIL
All other
subsidiaries Adjustments Total
(in millions)
Net cash provided by (used in)
operating activities .............. £ (34.5) £ 5.4 £ 6.8 £ (10.9) £0.0 £ 1,070.8 £0.0 £ 1,037.6
Investing activities:
Purchase of fixed and intangible
assets ......................... 0.0 0.0 0.0 0.0 0.0 (628.4) 0.0 (628.4)
Proceeds from sale of fixed assets .... 0.0 0.0 0.0 0.0 0.0 36.0 0.0 36.0
Principal repayments on loans to
equity investments .............. 0.0 0.0 0.0 0.0 0.0 8.4 0.0 8.4
Principal draw downs (repayments) on
loans to group companies ......... 479.9 173.7 (6.7) 1,556.1 0.0 (2,203.0) 0.0 0.0
Disposal of businesses, net .......... 0.0 0.0 0.0 0.0 0.0 167.4 0.0 167.4
Other ........................... 0.0 0.0 0.0 0.0 0.0 5.2 0.0 5.2
Net cash (used in) provided by
investing activities .............. 479.9 173.7 (6.7) 1,556.1 0.0 (2,614.4) 0.0 (411.4)
Financing activities:
New borrowings, net of financing
fees .......................... 0.0 0.0 0.0 (71.0) 0.0 3,143.0 0.0 3,072.0
Repurchase of common stock ....... (161.5) 0.0 0.0 0.0 0.0 0.0 0.0 (161.5)
Purchase of conversion hedges ...... (205.4) 0.0 0.0 0.0 0.0 0.0 0.0 (205.4)
Proceeds from employee stock option
exercises ...................... 17.0 0.0 0.0 0.0 0.0 0.0 0.0 17.0
Principal payments on long term debt
and capital leases ............... 0.0 (179.2) 0.0 (1,726.9) 0.0 (1,333.7) 0.0 (3,239.8)
Intercompany funding movements .... 22.8 0.0 0.0 (35.7) 0.0 12.9 0.0 0.0
Dividends paid ................... (34.1) 0.0 0.0 0.0 0.0 0.0 0.0 (34.1)
Net cash (used in) provided by
financing activities .............. (361.2) (179.2) 0.0 (1,833.6) 0.0 1,822.2 0.0 (551.8)
Cash flow from discontinued
operations:
Net cash used in operating activities . . 0.0 0.0 0.0 0.0 0.0 (30.1) 0.0 (30.1)
Net cash used in discontinued
operations ..................... 0.0 0.0 0.0 0.0 0.0 (30.1) 0.0 (30.1)
Effect of exchange rates changes on
cash and cash equivalents ......... 4.7 0.0 0.0 0.0 0.0 0.0 0.0 4.7
Increase (decrease) in cash and cash
equivalents .................... 88.9 (0.1) 0.1 (288.4) 0.0 248.5 0.0 49.0
Cash and cash equivalents at beginning
of period ...................... 12.4 1.9 0.3 292.9 0.0 123.0 0.0 430.5
Cash and cash equivalents at end of
period ........................ £101.3 £ 1.8 £ 0.4 £ 4.5 £0.0 £ 371.5 £0.0 £ 479.5
F-64