Virgin Media 2011 Annual Report Download - page 37
Download and view the complete annual report
Please find page 37 of the 2011 Virgin Media annual report below. You can navigate through the pages in the report by either clicking on the pages listed below, or by using the keyword search tool below to find specific information within the annual report.-
 1
1 -
2
-
3
-
4
-
5
-
6
-
7
-
8
-
9
-
10
-
11
-
12
-
13
-
14
-
15
-
16
-
17
-
18
-
19
-
20
-
21
-
22
-
23
-
24
-
25
-
26
-
 27
27 -
 28
28 -
 29
29 -
 30
30 -
 31
31 -
 32
32 -
 33
33 -
 34
34 -
 35
35 -
 36
36 -
 37
37 -
 38
38 -
 39
39 -
 40
40 -
 41
41 -
 42
42 -
 43
43 -
 44
44 -
 45
45 -
 46
46 -
 47
47 -
48
-
49
-
50
-
51
-
52
-
53
-
54
-
55
-
56
-
57
-
58
-
59
-
60
-
61
-
62
-
63
-
64
-
65
-
66
-
67
-
68
-
69
-
70
-
71
-
72
-
73
-
74
-
75
-
76
-
77
-
78
-
79
-
80
-
81
-
82
-
83
-
84
-
85
-
86
-
87
-
88
-
89
-
90
-
91
-
92
-
93
-
94
-
95
-
96
-
97
-
98
-
99
-
100
-
101
-
102
-
103
-
104
-
105
-
106
-
107
-
108
-
109
-
110
-
111
-
112
-
113
-
114
-
115
-
116
-
117
-
118
-
119
-
120
-
121
-
122
-
123
-
124
-
125
-
126
-
127
-
128
-
129
-
130
-
131
-
132
-
133
-
134
-
135
-
136
-
137
-
138
-
139
-
140
-
141
-
142
-
143
-
144
-
145
-
146
-
147
-
148
-
149
-
150
-
151
-
152
-
153
-
154
-
155
-
156
-
157
-
158
-
159
-
160
-
161
-
162
-
163
-
164
-
165
-
166
-
167
-
168
-
169
-
170
-
171
-
172
-
173
-
174
-
175
-
176
-
177
-
178
-
179
-
180
-
181
-
182
-
183
-
184
-
185
-
186
-
187
-
188
-
189
-
190
-
191
-
192
-
193
-
194
-
195
-
196
-
197
-
198
-
199
-
200
-
201
-
202
-
203
-
204
-
205
-
206
-
207
-
208
-
209
-
210
-
211
-
212
-
213
-
214
-
215
-
216
-
217
-
218
 |
 |

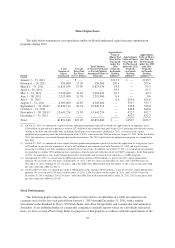
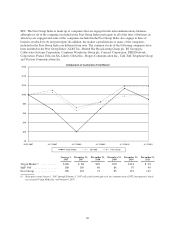
SEC. The Peer Group Index is made up of companies that are engaged in the telecommunications business,
although not all of the companies included in the Peer Group Index participate in all of the lines of business in
which we are engaged and some of the companies included in the Peer Group Index also engage in lines of
business in which we do not participate. In addition, the market capitalizations of many of the companies
included in the Peer Group Index are different from ours. The common stocks of the following companies have
been included in the Peer Group Index: AT&T Inc., British Sky Broadcasting Group plc, BT Group plc,
Cablevision Systems Corporation, Carphone Warehouse Group plc, Comcast Corporation, DISH Network
Corporation, France Telecom SA, Liberty Global Inc., Rogers Communication Inc., Talk Talk Telephone Group
and Verizon Communications Inc.
01/01/2007 31/12/2007 31/12/2008 31/12/2009 31/12/2010 31/12/2011
$0
$20
$40
$60
$80
$100
$120
$140
$160 Comparison of Cumulative Total Return
Virgin Media S&P 500 Peer Group
January 1,
2007
December 31,
2007
December 31,
2008
December 31,
2009
December 31,
2010
December 31,
2011
Virgin Media(1) ............ $100 $ 68 $20 $70 $114 $ 90
S&P500 ................. 100 105 66 84 97 99
Peer Group ................ 100 110 72 85 119 119
(1) Share prices from January 1, 2007 through February 5, 2007 reflect the historic prices of the common stock of NTL Incorporated, which
was renamed Virgin Media Inc. on February 6, 2007.
36