Virgin Media 2011 Annual Report Download - page 174
Download and view the complete annual report
Please find page 174 of the 2011 Virgin Media annual report below. You can navigate through the pages in the report by either clicking on the pages listed below, or by using the keyword search tool below to find specific information within the annual report.-
 1
1 -
2
-
3
-
4
-
5
-
6
-
7
-
8
-
9
-
10
-
11
-
12
-
13
-
14
-
15
-
16
-
17
-
18
-
19
-
20
-
21
-
22
-
23
-
24
-
25
-
26
-
27
-
28
-
29
-
30
-
31
-
32
-
33
-
34
-
35
-
36
-
37
-
38
-
39
-
40
-
41
-
42
-
43
-
44
-
45
-
46
-
47
-
48
-
49
-
50
-
51
-
52
-
53
-
54
-
55
-
56
-
57
-
58
-
59
-
60
-
61
-
62
-
63
-
64
-
65
-
66
-
67
-
68
-
69
-
70
-
71
-
72
-
73
-
74
-
75
-
76
-
77
-
78
-
79
-
80
-
81
-
82
-
83
-
84
-
85
-
86
-
87
-
88
-
89
-
90
-
91
-
92
-
93
-
94
-
95
-
96
-
97
-
98
-
99
-
100
-
101
-
102
-
103
-
104
-
105
-
106
-
107
-
108
-
109
-
110
-
111
-
112
-
113
-
114
-
115
-
116
-
117
-
118
-
119
-
120
-
121
-
122
-
123
-
124
-
125
-
126
-
127
-
128
-
129
-
130
-
131
-
132
-
133
-
134
-
135
-
136
-
137
-
138
-
139
-
140
-
141
-
142
-
143
-
144
-
145
-
146
-
147
-
148
-
149
-
150
-
151
-
152
-
153
-
154
-
155
-
156
-
157
-
158
-
159
-
160
-
161
-
162
-
163
-
 164
164 -
 165
165 -
 166
166 -
 167
167 -
 168
168 -
 169
169 -
 170
170 -
 171
171 -
 172
172 -
 173
173 -
 174
174 -
 175
175 -
 176
176 -
 177
177 -
 178
178 -
 179
179 -
 180
180 -
 181
181 -
 182
182 -
 183
183 -
 184
184 -
185
-
186
-
187
-
188
-
189
-
190
-
191
-
192
-
193
-
194
-
195
-
196
-
197
-
198
-
199
-
200
-
201
-
202
-
203
-
204
-
205
-
206
-
207
-
208
-
209
-
210
-
211
-
212
-
213
-
214
-
215
-
216
-
217
-
218
 |
 |

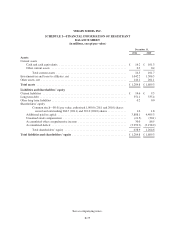
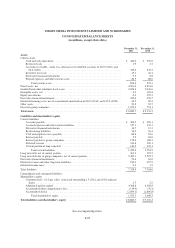
VIRGIN MEDIA INVESTMENTS LIMITED AND SUBSIDIARIES
CONSOLIDATED BALANCE SHEETS
(in millions, except share data)
December 31,
2011
December 31,
2010
Assets
Current assets
Cash and cash equivalents ................................................... £ 282.0 £ 376.0
Restricted cash ........................................................... 1.9 2.2
Accounts receivable—trade, less allowances for doubtful accounts of £10.9 (2011) and
£6.4 (2010) ............................................................ 435.4 431.2
Inventory for resale ........................................................ 13.1 26.4
Derivative financial instruments .............................................. 9.5 0.8
Prepaid expenses and other current assets ...................................... 82.5 88.6
Total current assets .................................................... 824.4 925.2
Fixed assets, net .............................................................. 4,501.6 4,651.0
Goodwill and other indefinite-lived assets .......................................... 2,026.6 2,026.6
Intangible assets, net ........................................................... 0.0 118.4
Equity investments ............................................................ 0.0 359.2
Derivative financial instruments .................................................. 209.6 202.7
Deferred financing costs, net of accumulated amortization of £28.0 (2011) and £19.6 (2010) . . 44.5 89.4
Other assets .................................................................. 50.8 52.7
Due from group companies ...................................................... 1,223.2 751.1
Total assets .................................................................. £8,880.7 £ 9,176.3
Liabilities and shareholder's equity
Current liabilities
Accounts payable ......................................................... £ 304.3 £ 296.1
Accrued expenses and other current liabilities ................................... 337.1 376.3
Derivative financial instruments .............................................. 16.7 13.3
Restructuring liabilities ..................................................... 34.9 56.4
VAT and employee taxes payable ............................................. 88.4 83.6
Interest payable ........................................................... 9.9 18.0
Interest payable to group companies ........................................... 178.6 188.3
Deferred revenue .......................................................... 311.8 300.1
Current portion of long term debt ............................................. 140.9 222.1
Total current liabilities ................................................. 1,422.6 1,554.2
Long term debt, net of current portion ............................................. 263.3 353.7
Long term debt due to group companies, net of current portion .......................... 5,399.1 5,587.7
Derivative financial instruments .................................................. 53.4 62.0
Deferred revenue and other long term liabilities ...................................... 190.0 207.2
Deferred income taxes .......................................................... 0.0 3.2
Total liabilities ............................................................... 7,328.4 7,768.0
Commitments and contingent liabilities
Shareholder's equity
Common stock—£1.0 par value; issued and outstanding 2.5 (2011 and 2010) ordinary
shares ................................................................. 2.5 2.5
Additional paid-in capital ................................................... 4,368.8 4,368.8
Accumulated other comprehensive loss ........................................ (119.9) (76.2)
Accumulated deficit ....................................................... (2,699.1) (2,886.8)
Total shareholder's equity ............................................... 1,552.3 1,408.3
Total liabilities and shareholder's equity ......................................... £8,880.7 £ 9,176.3
See accompanying notes.
F-85