Virgin Media 2011 Annual Report Download - page 119
Download and view the complete annual report
Please find page 119 of the 2011 Virgin Media annual report below. You can navigate through the pages in the report by either clicking on the pages listed below, or by using the keyword search tool below to find specific information within the annual report.-
 1
1 -
2
-
3
-
4
-
5
-
6
-
7
-
8
-
9
-
10
-
11
-
12
-
13
-
14
-
15
-
16
-
17
-
18
-
19
-
20
-
21
-
22
-
23
-
24
-
25
-
26
-
27
-
28
-
29
-
30
-
31
-
32
-
33
-
34
-
35
-
36
-
37
-
38
-
39
-
40
-
41
-
42
-
43
-
44
-
45
-
46
-
47
-
48
-
49
-
50
-
51
-
52
-
53
-
54
-
55
-
56
-
57
-
58
-
59
-
60
-
61
-
62
-
63
-
64
-
65
-
66
-
67
-
68
-
69
-
70
-
71
-
72
-
73
-
74
-
75
-
76
-
77
-
78
-
79
-
80
-
81
-
82
-
83
-
84
-
85
-
86
-
87
-
88
-
89
-
90
-
91
-
92
-
93
-
94
-
95
-
96
-
97
-
98
-
99
-
100
-
101
-
102
-
103
-
104
-
105
-
106
-
107
-
108
-
 109
109 -
 110
110 -
 111
111 -
 112
112 -
 113
113 -
 114
114 -
 115
115 -
 116
116 -
 117
117 -
 118
118 -
 119
119 -
 120
120 -
 121
121 -
 122
122 -
 123
123 -
 124
124 -
 125
125 -
 126
126 -
 127
127 -
 128
128 -
 129
129 -
130
-
131
-
132
-
133
-
134
-
135
-
136
-
137
-
138
-
139
-
140
-
141
-
142
-
143
-
144
-
145
-
146
-
147
-
148
-
149
-
150
-
151
-
152
-
153
-
154
-
155
-
156
-
157
-
158
-
159
-
160
-
161
-
162
-
163
-
164
-
165
-
166
-
167
-
168
-
169
-
170
-
171
-
172
-
173
-
174
-
175
-
176
-
177
-
178
-
179
-
180
-
181
-
182
-
183
-
184
-
185
-
186
-
187
-
188
-
189
-
190
-
191
-
192
-
193
-
194
-
195
-
196
-
197
-
198
-
199
-
200
-
201
-
202
-
203
-
204
-
205
-
206
-
207
-
208
-
209
-
210
-
211
-
212
-
213
-
214
-
215
-
216
-
217
-
218
 |
 |

VIRGIN MEDIA INC. AND SUBSIDIARIES
NOTES TO CONSOLIDATED FINANCIAL STATEMENTS (continued)
Note 8—Fair Value Measurements (continued)
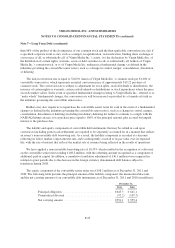
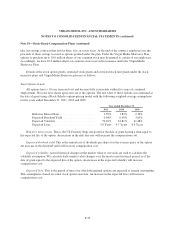
If the price of our stock is below $19.22 upon maturity of the convertible senior notes, the options may be
allowed to expire unused.
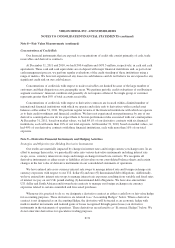
We have determined that the overall valuation of the conversion hedges falls within level 3 of the fair value
hierarchy as the assumption for the expected volatility of our stock price over the term of the options is based on
an unobservable input and is deemed to be significant to the determination of fair value. Non-performance risk is
based on quoted credit default swaps for counterparties to the contracts. The inclusion of counterparty
non-performance risk resulted in a decrease to the fair values of the conversion hedges of approximately
£25.0 million and £19.0 million as of December 31, 2011 and 2010 respectively, and an increase in the loss on
derivative instruments of £6.0 million and £19.0 million in the years ended December 31, 2011 and 2010
respectively.
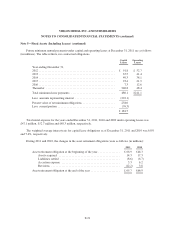
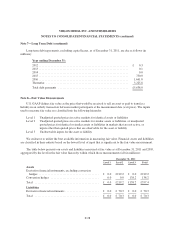
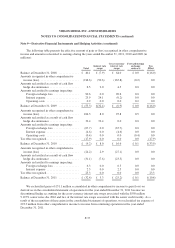
The following table presents a reconciliation of the beginning and ending balances of the conversion hedges
(in millions);
2011 2010
Balance at January 1 ......................................... £191.9 £ 0.0
Purchases .................................................. 0.0 205.4
Unrealized loss included in loss on derivative instruments ........... (52.6) (13.5)
Unrealized currency translation adjustment included in other
comprehensive income ..................................... (1.1) 0.0
Balance at December 31 ...................................... £138.2 £191.9
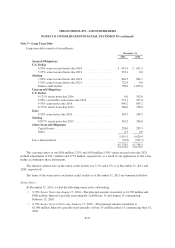
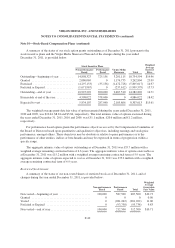
Long term debt: The fair values of our senior notes, convertible senior notes and senior secured notes are
based on the quoted market prices in active markets and incorporate non-performance risk. The carrying values
of the $500 million 5.25% and £650 million 5.50% senior secured notes due 2021 include adjustments of
£45.7 million and £77.9 million, respectively, as a result of our application of fair value hedge accounting to
these instruments.
The carrying amounts and fair values of our long term debt are as follows (in millions):
December 31, 2011 December 31, 2010
Carrying
Amount
Fair
Value
Carrying
Amount
Fair
Value
9.125% U.S. dollar senior notes due 2016 ....................... £ 0.0 £ 0.0 £ 352.6 £ 380.3
6.50% U.S. dollar convertible senior notes due 2016 ............... 551.1 869.1 535.4 1,050.8
9.50% U.S. dollar senior notes due 2016 ........................ 849.2 966.4 843.2 990.5
9.50% euro senior notes due 2016 .............................. 145.3 170.1 148.5 182.1
8.375% U.S. dollar senior notes due 2019 ....................... 380.6 416.9 378.8 421.5
8.875% sterling senior notes due 2019 .......................... 345.2 378.9 344.8 397.7
6.50% U.S. dollar senior secured notes due 2018 .................. 635.4 663.5 632.3 677.5
7.00% sterling senior secured notes due 2018 ..................... 864.5 923.1 863.1 925.3
5.25% U.S. dollar senior secured notes due 2021 .................. 353.1 321.8 0.0 0.0
5.50% sterling senior secured notes due 2021 ..................... 722.4 640.3 0.0 0.0
Senior credit facility ........................................ 750.0 750.0 1,675.0 1,672.5
Capital leases and other ...................................... 258.3 258.3 246.7 246.7
F-30