Virgin Media 2011 Annual Report Download - page 64
Download and view the complete annual report
Please find page 64 of the 2011 Virgin Media annual report below. You can navigate through the pages in the report by either clicking on the pages listed below, or by using the keyword search tool below to find specific information within the annual report.-
 1
1 -
2
-
3
-
4
-
5
-
6
-
7
-
8
-
9
-
10
-
11
-
12
-
13
-
14
-
15
-
16
-
17
-
18
-
19
-
20
-
21
-
22
-
23
-
24
-
25
-
26
-
27
-
28
-
29
-
30
-
31
-
32
-
33
-
34
-
35
-
36
-
37
-
38
-
39
-
40
-
41
-
42
-
43
-
44
-
45
-
46
-
47
-
48
-
49
-
50
-
51
-
52
-
53
-
 54
54 -
 55
55 -
 56
56 -
 57
57 -
 58
58 -
 59
59 -
 60
60 -
 61
61 -
 62
62 -
 63
63 -
 64
64 -
 65
65 -
 66
66 -
 67
67 -
 68
68 -
 69
69 -
 70
70 -
 71
71 -
 72
72 -
 73
73 -
 74
74 -
75
-
76
-
77
-
78
-
79
-
80
-
81
-
82
-
83
-
84
-
85
-
86
-
87
-
88
-
89
-
90
-
91
-
92
-
93
-
94
-
95
-
96
-
97
-
98
-
99
-
100
-
101
-
102
-
103
-
104
-
105
-
106
-
107
-
108
-
109
-
110
-
111
-
112
-
113
-
114
-
115
-
116
-
117
-
118
-
119
-
120
-
121
-
122
-
123
-
124
-
125
-
126
-
127
-
128
-
129
-
130
-
131
-
132
-
133
-
134
-
135
-
136
-
137
-
138
-
139
-
140
-
141
-
142
-
143
-
144
-
145
-
146
-
147
-
148
-
149
-
150
-
151
-
152
-
153
-
154
-
155
-
156
-
157
-
158
-
159
-
160
-
161
-
162
-
163
-
164
-
165
-
166
-
167
-
168
-
169
-
170
-
171
-
172
-
173
-
174
-
175
-
176
-
177
-
178
-
179
-
180
-
181
-
182
-
183
-
184
-
185
-
186
-
187
-
188
-
189
-
190
-
191
-
192
-
193
-
194
-
195
-
196
-
197
-
198
-
199
-
200
-
201
-
202
-
203
-
204
-
205
-
206
-
207
-
208
-
209
-
210
-
211
-
212
-
213
-
214
-
215
-
216
-
217
-
218
 |
 |

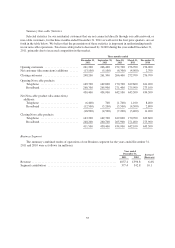
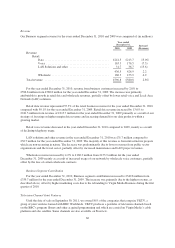
Non-cable revenue for the year ended December 31, 2010 increased to £77.2 million from £58.7 million for
the year ended December 31, 2009. The increased non-cable revenue was predominantly driven by the new
service offerings which were launched in August 2009 as discussed further in “Summary Non-cable Statistics”
below.
Consumer Segment Contribution
For the year ended December 31, 2010, Consumer segment contribution increased to £1,982.4 million from
£1,841.9 million for the year ended December 31, 2009. This increase was primarily due to the increase in
consumer revenues as described above.
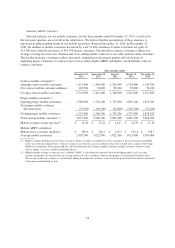
Summary Cable Statistics
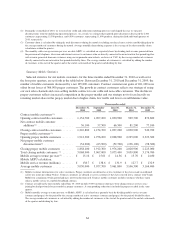
Selected statistics for our cable customers, for the three months ended December 31, 2010 as well as the
four prior quarters, are set forth in the table below. Our net customer movement for the three months ended
December 31, 2010 was an increase of 17,100 customers being the net of gross additions and disconnections (net
additions). Customer churn remained relatively stable throughout the years ended December 31, 2010 and 2009
and average monthly churn was 1.3% in the three months ended December 31, 2010 compared to 1.2% in the
three months ended 31 December 2009. The total number of cable products grew to 11,951,600 at December 31,
2010 from 11,678,300 at December 31, 2009, representing a net increase in products of 273,300.
Three months ended
December 31, September June 30, March 31, December 31,
2010 2010 2010 2010 2009
Opening customers(1) .............. 4,783,000 4,768,900 4,761,800 4,723,500 4,694,900
Customer additions ............... 206,600 236,000 188,600 193,100 198,600
Customer disconnects(2) ............ (189,500) (221,900) (181,500) (154,800) (170,000)
Net customer additions ............ 17,100 14,100 7,100 38,300 28,600
Closing customers(1) .............. 4,800,100 4,783,000 4,768,900 4,761,800 4,723,500
Cable churn(1)(3) .................. 1.3% 1.6% 1.3% 1.1% 1.2%
Cable products:
Television(1) ................. 3,778,800 3,766,700 3,751,900 3,729,600 3,693,900
DTV (included in
Television) ............ 3,759,600 3,745,900 3,728,700 3,702,800 3,656,200
ATV (included in
Television)(1) .......... 19,200 20,800 23,200 26,800 37,700
Telephone .................. 4,161,700 4,161,000 4,175,300 4,178,000 4,146,600
Broadband .................. 4,011,100 3,969,800 3,936,000 3,910,100 3,837,800
Total cable products .............. 11,951,600 11,897,500 11,863,200 11,817,700 11,678,300
Cable products/Customer(1) ......... 2.49x 2.49x 2.49x 2.48x 2.47x
Triple-play penetration(1) ........... 63.0% 62.7% 62.4% 61.9% 61.1%
Cable Average Revenue Per
User(1)(4) ..................... £ 47.51 £ 46.38 £ 45.88 £ 45.01 £ 45.28
Cable ARPU calculation:
Cable revenue (millions) ........... £ 682.8 £ 662.6 £ 656.4 £ 640.0 £ 640.1
Average customers(1) .............. 4,790,000 4,763,400 4,768,800 4,739,500 4,712,600
(1) As part of our analog switch off program during the first quarter of 2010 we identified 49,300 analog customers as of December 31, 2009
that we did not expect to convert to digital products and services. These customers were previously reflected in our Summary Cable
Statistics as both customers and ATV products. As they did not receive any directly billable services from us they were not included in
our Summary Cable Statistics commencing with the first quarter of 2010. To ensure our statistics are presented on a comparable basis,
we have removed 49,300 customers from our customer and ATV product numbers for all previously reported periods. The following
statistics were recalculated: Opening and Closing customers, Cable churn, Cable products—Television and ATV, Cable products/
Customer, Triple-play penetration, Cable ARPU, Average customers.
63